

There’s not really a lot more we can say about KATE that the stock move is not already saying. But from where we sit, it is absolutely not over. It remains high on our Best Ideas list. We think that the company is marching toward $3+ in earnings power – nearly double the consensus. And if we’re right, then we think that KATE will be at $50 at year-end, and has the greatest likelihood of doubling this year out of any retailer or brand. For full details, on our thesis, see our KATE Black Book released last quarter: CLICK HERE.
A few big picture points…
- Quarter looked astounding. Comp accelerated materially to 28% from 15% in 3Q. 2 year comp accelerated from 23% to 29%. Not many companies in this macro climate have growth accelerating off such a strong base (or any base).
- They’re shutting down Jack Spade and Kate Spade Saturday – two non core concepts that have been a big source of contention for the investment community. They can take these stores, and convert into Kate Spade NY. Nice real estate optionality there. This is precisely what we highlighted in our deck last quarter. We applaud management for acting quickly to remedy the dilutive effect of the brands. Our math suggests it was about a $0.20 hit for the year. And took EBITDA margin rate down about 200bps.
- Guidance is a little light for 2015 – only a hsd comp. But let’s face it, this company has zero credibility with guidance. Started off 2014 guiding for 10-13%, and it came in at 26% for the year. Ignore what they say, and focus on what they do. They’ll crush their guidance. Comp: No change to our model for FY15 which calls for high teen comps and EBITDA of $220mm.
- E-commerce: Online was an absolute monster this quarter. Assuming that brick and mortar is 80% of the consolidated revenue, that implies that online was up 56%. Consistent with what we saw in the traffic trends coming out of the 3rd quarter and through the Holiday.
Below is our latest note, including our check on business trends, most of which were spot-on.

01/23/15 08:29 AM EST
KATE - WALL OF SILENCE BROKEN
There's a first time for everything. KATE pre-announced that next Thursday it is going to pre-announce. As bizarre as this seems to be, the only negative is that it confirms a severe disconnect between this company's communication strategy vs. the fundamental strength in its business, and the upside to the long-term financial model.
As we stated on January 14th (see below) we welcome a pre-announcement, as it bulldozes the 15 week wall of silence between the start of the abnormally long quiet period and the print.
We think the company's presentation next week will quiet many of the errant bear cases that have hurt the stock so much year to date.
01/14/15 10:10 PM EST
KATE - RISK REWARD LOOKS SOLID HERE
Takeaway: There’s been way too much misinformation on KATE in Jan-to-date. Trends are better than people think. Risk/reward here is outstanding.
We think that KATE’s risk/reward on the long side is simply too great to pass up with the stock in the mid-$20s. KATE is down -17.1% since the start of the year (over a whopping 9 trading sessions), vs -1.1% for the XRT due to factors that we think largely have no merit. We think that the brand is extremely healthy, business trends are strong, and the growth trajectory is squarely in-tact. In short, based on the earnings ramp we’re expecting to be evident over the next year, we think that KATE is looking at 50% base case upside from today’s $26.80. That’s $13.50 upside with what we think is about $5 downside – a risk reward we’re more than prepared to take given our view that KATE probably has the best likelihood of doubling out of any US retail name this year.
OUR ANSWERS TO NINE DAYS OF INVESTOR CONCERNS
1. Shhhh…. We’ll start with the concern that is the most valid, and that’s the Wall of Silence that emanates from the company. KATE’s quiet period started on Thanksgiving, and it might not report its fourth quarter until the first week of March. That’s about 15 weeks of sheer silence. Seriously, we’re going to see retailers on a January fiscal year report 4Q before KATE does. At this rate, nothing would make us happier than if KATE preannounced. It did so last year at this time – though that was before a series of investor meetings that are not happening this year. With no information coming from the company, investors are taking negative anecdotes and trading the stock down with nobody to answer the many questions that are swirling around. We can give it our best shot, but what we want is a press release out of KATE.
2. ‘Excessive Discounting’ in the Department Store Channel. This was what set the stock into its initial spiral. Analyst reports talked about excessive discounting, without a) adding the context of the fact that wholesale handbags account for only 15% of KATE’s sales, b) looking at a balance of discounts for a representative sample of wholesalers over the course of the entire quarter/holiday season, and most importantly, c) without looking at the discounting cadence versus last year. Looking at sequential changes in pricing without considering velocity, inventory, and what trends were a year ago is an otherwise useless exercise. In sum, we did not find anything in any of the reports that struck as valid or concerning.
3. Promotions Are NOT Greater Than Last Year. The graphic below shows the promotions in 2013 versus 2014. While there are some variances vs last year, one major point we can make is that there was NOT a more promotional cadence this year online. Rest assured that if KATE’s wholesale sales or store sales were suffering, there would be unexpected sales that would pop up online. That definitely did not happen. Some subtleties…
- In 2014 KATE moved the October surprise sale back a week into Nov. Online traffic started to pick up immediately thereafter (see below).
- Mid November 25% off offer was 2 days longer this year.
- This year the Black Friday sales was shorter, but cyber Monday sale was longer.
- Surprise sale in mid-December was a one day 75% off sale last year, this year it was a 2 day sale but it didn’t advertise any specific discount (gifts $99and under), as KATE shifts away from 70%+ ‘Flash’ Sales.
- The 25% off sale items started earlier this year, will end up being 20 days vs 11 last year.
EXHIBIT 2: KATE PROMOTIONS VS LAST YEAR

4. KATE On-Line Presence. We measure traffic trends for about 250 brands and retailers by triangulating many different sources. The reality is that no one source is accurate anything more than 2/3 of the time. But this approach has proven to be a very strong gauge of a company’s business. Could it be that there are excessive promotions driving traffic? No – as we already outlined in point #3 above. If we saw excessive emails promos and accelerating traffic we’d be concerned. No need to be concerned here.
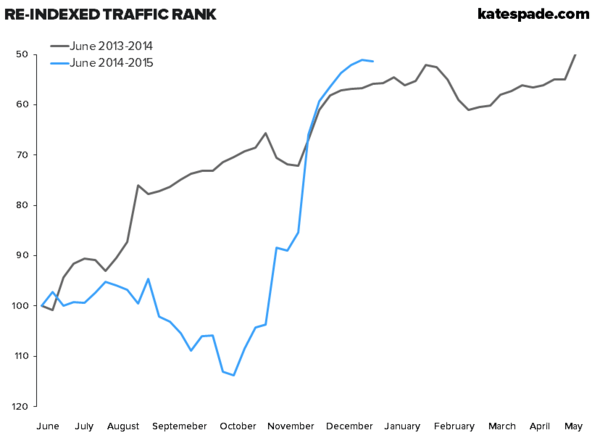
- Exhibit 3 is the Indexed traffic rank for katespade.com. We re-indexed in June 2014 (blue line) when we hit the YY mark. Not the way we typically look at this metric, but it does a good job accentuating the ramp we’ve seen in traffic rank since mid-October. You can see the divergence in performance compared to last year from July-September which coincided with the comp slowdown we saw in 3Q. Since it is a 90-day moving average the best reflection of the quarter in aggregate is the 12/28 reading – on that date Traffic Rank was up 55% YY.
EXHIBIT 3: KATE INDEXED TRAFFIC RANK
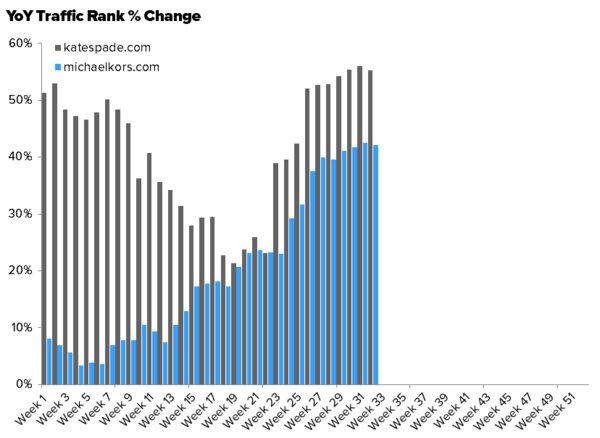
- Exhibit 4 looks at the year over year change in traffic for both katespade.com and michaelkors.com. There is a meaningful divergence between the two starting in Week 22, which, because of the way we indexed, equates to 11/4/14. Week 30 marks the quarter end and as in the earlier chart is the best reflection of the quarter in aggregate because it is a 90-day moving average. The reading on that day was +55%. This is big for KATE with online accounting for about 20% of revenue compared to KORS who set a 2-3yr target to hit 10%. Overall demand in that channel looked very healthy throughout the quarter and especially so during the Holiday selling period.
EXHIBIT 4: Y/Y TRAFFIC RANK – KATE VS KORS
- Exhibit 5 shows the YY reach spread for KATE, KORS, and COH – which captures the change in total reach online versus a year ago. Anything above the x-axis is positve, anything below = negative. Trend here is the same as in previous charts though you can see the relative outperformance around Black Friday/Cyber Monday through the holiday in more detail when compared to KORS and COH.
EXHIBIT 5: KATE, KORS, COH REACH

