
Bottoms are in fact processes, and a combination of project delays, cap-ex cuts (25% in the E&P sector), and drilling stoppages are moving to provide INCREMENTAL support to oil prices. In any time series we contextualize each new data point on the margin (acceleration or deceleration in the current trend.)
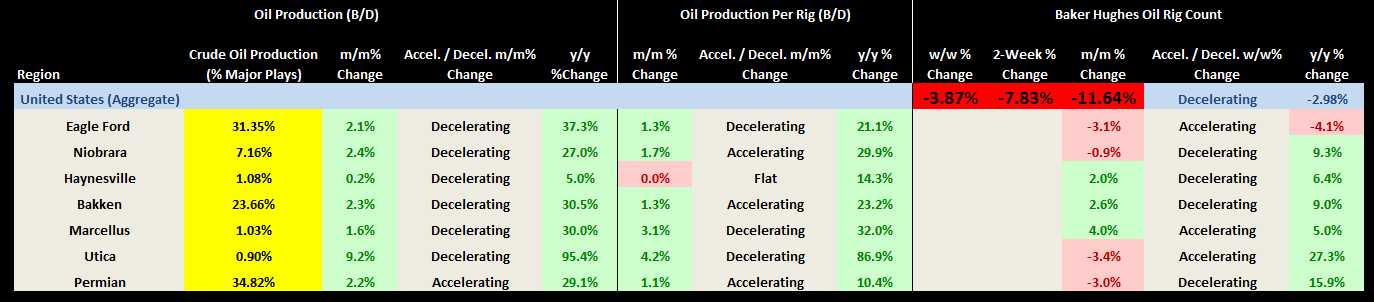
The marginal changes in the table below are very clear with regards to the production outlook for U.S. producers. Of note is that we are showing crude oil production because of the 135 rigs that have come off in the last two weeks, only 19 of those were purely gas-based. The regional data is released monthly while the aggregate data through today is represented in red.
- Crude oil production in the U.S. is increasing at a DECELERATING rate
- Production per rig has been in an upward TREND since 2011, mainly because of technological advances, but the delta-positive TREND is now DECELERATING
- In aggregate the Baker Hughes Rig Count in the United States is decreasing at an ACCELERATING rate with the two largest oil-producing plays already following this trend through the December data release of the EIA’s Drilling Productivity Report
History often rhymes, and we have once again confronted the reality that in a capital intensive world, supply/demand imbalances are not corrected overnight.
While the world was much different in 2008, E&P companies are very sensitive to oil prices under any circumstance. WTI declined 77% from July 3rd , 2008 to December 19th 2008. The oil rig count topped almost exactly 4-months after the July highs on November 7th , 2008 before being cut in half by June of 2009 (6-months after oil bottomed in December).
We haven’t seen quite the rout in WTI, but we expect the TREND of rigs coming offline to continue at least through the first quarter.
While the macro process is signaling the pressure on crude oil remains, we want to call out our incremental absorbtion of an important data point that has remained a central theme in our macro view since moving into QUAD#4. Communicating the process is everything.
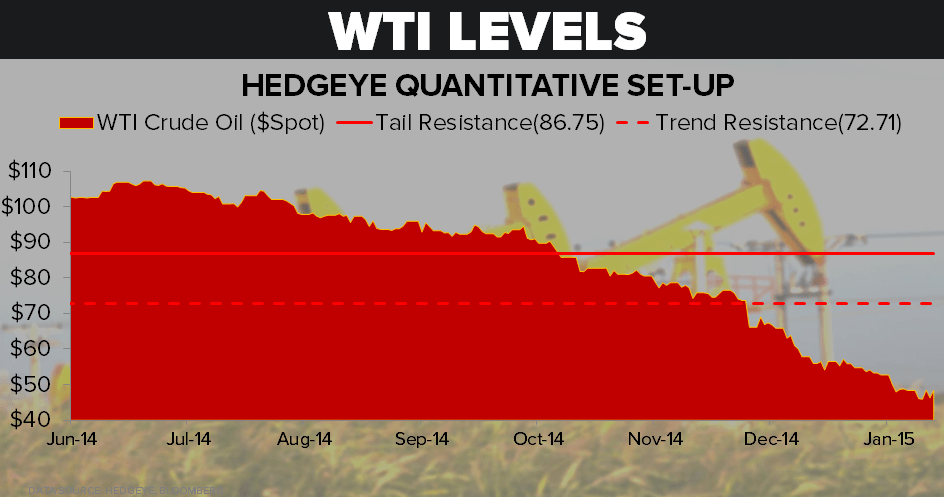
WTI is testing the top end of our Immediate-term TRADE range within a BEARISH TREND/TAIL set-up. A model that contextualizes macro across durations provides a check from reversing our process with each new piece of information. Relying on human nature alone to make consistent, clear decisions gets hairy.
Ben Ryan
Analyst
