

Our Hedgeye Housing Compendium table (below) aspires to present the state of the housing market in a visually-friendly format that takes about 30 seconds to consume.

Today's Focus: October S&P/Case-Shiller Home Price Report
THE DATA: The Case-Shiller HPI data for October showed home prices growing +4.5% YoY, decelerating -30bps from +4.8% in September. Recall that the Case-Shiller HPI series is constructed as a 3-month moving average so the October release reflects HPI changes over the Aug-to-Oct period, effectively amounting to September data. The Case-Shiller series tracks the Corelogic data closely, but on a lag, and with the Corelogic figures released almost a full month before Case-Shiller, the slope and likely magnitude of the C-S HPI is pretty well advertised.
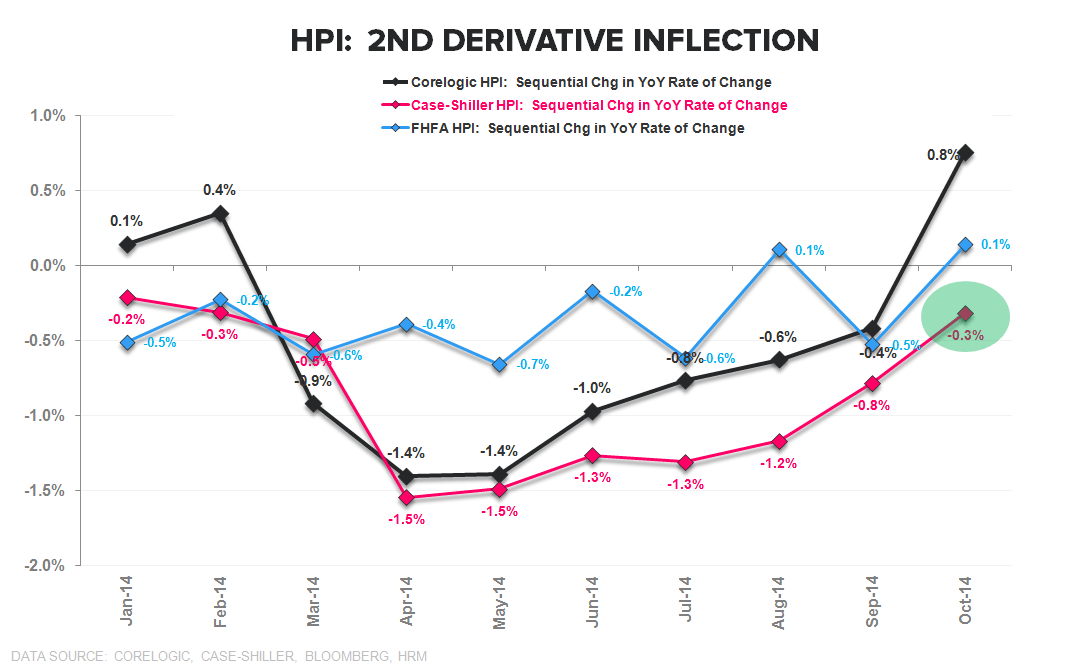
BOTTOM-LINE: Home-Price growth continued to decelerate but, from a modeling perspective, we're primarily concerned with the rate of deceleration and, on that score, the trend remains one of improvement. The sequential change in the YoY Rate of Change improved to -0.3% in October from -0.8% the month prior. As we’ve highlighted alongside the other HPI releases, all three primary price series are now confirming the same (2nd derivative) stabilization story. The 1st chart below illustrates that trend. Given the correlation between 2nd derivative HPI trends and housing related equities, a stabilization/re-acceleration in home price growth augurs positively for the group.


About Case Shiller:
The S&P/Case-Shiller Home Price Index measures the changes in value of residential real estate by tracking single-family home re-sales in 20 metropolitan areas across the US. The index uses purchase price information obtained from county assessor and recorder offices. The Case-Shiller indexes are value-weighted, meaning price trends for more expensive homes have greater influence on estimated price changes than other homes. It is vital to note that the index’s printed number is a 3-month rolling average released on a two month delay.
Frequency and Release Date:
The S&P/Case-Shiller HPI is released on the last Tuesday of every month. The index is on a two month lag and therefore does not reflect the most recent month’s home prices.
Joshua Steiner, CFA
Christian B. Drake
