Editor's note: Below is a brief excerpt from today's Morning Newsletter by Hedgeye CEO Keith McCullough. Click here for more information on how you can become a subscriber to the fastest-growing independent research firm in America.
For those of you who don’t know that breakevens are a leading indicator for the rate of change in inflation expectations, now you know. For all of you who know that falling bond yields and flattening yield curves are leading indicators for #GrowthSlowing, well, you still know that… but need to ignore it on low-volume SPY ramps into your year-end!
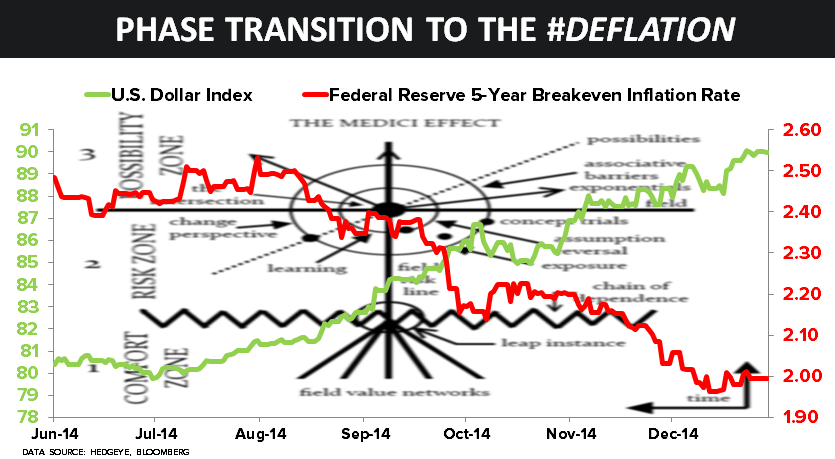
In the last 6 months, what we (and physicists like Cooper) call a phase transition (from bullish to bearish) in #deflation has been much more pronounced than the macro market acknowledging it as a #deflation risk in the 1st 2 weeks of December. To put that in time/price context, check out these 6 month moves:
- Japanese Yen -15.5% vs. USD (yes, that was on Japanese #GrowthSlowing to the point where they needed more QE)
- Euro -10.5% vs USD (as the Draghi devalued in response to #GrowthSlowing)
- CRB Commodities Index #crashed -24.8% in the last 6 months
- Oil (WTI) #crashed -45.7% in the last 6 months
- Natural Gas #crashed -34.3% in the last 6 months
And 5yr breakevens were actually down a lot more in the last 6 months (-90bps, or -43%) than they’ve been for the YTD (remember when late-cycle inflation accelerated in the first half of 2014 and the perma growth bulls just called that bullish for consumers too?).
