

Investment Company Institute Mutual Fund Data and ETF Money Flow:
As markets tumbled prior the Federal Reserve's announcement that it would be patient in raising interest rates, investors continued to pull capital from funds across the board in the most recent ICI survey ending December 17th. Only tax-free bonds and fixed income ETFs experienced inflows (+$950 million and +$3.8 billion respectively) although aggregate total net bond funds lost $5.6 billion last week with the $10.3 billion withdrawal in taxable bonds. Total equity products (ICI mutual funds and all ETFs according to Bloomberg) lost $12.4 billion last week according to the ICI.

In the most recent 5 day period ending December 17th, total equity mutual funds put up net outflows of $6.6 billion according to the Investment Company Institute. The outflow was composed of domestic stock fund withdrawals of $4.2 billion and international stock fund withdrawals of $2.4 billion. The international and domestic equity categories have been polarized this year with international stock funds having inflows in 48 of the past 50 weeks, versus domestic trends which have been very soft with inflow in just 16 of the past 50 weeks. The running year-to-date weekly average for all equity fund flow continues to decline and now settles at a $702 million inflow, well below the $3.1 billion weekly average inflow from 2013.
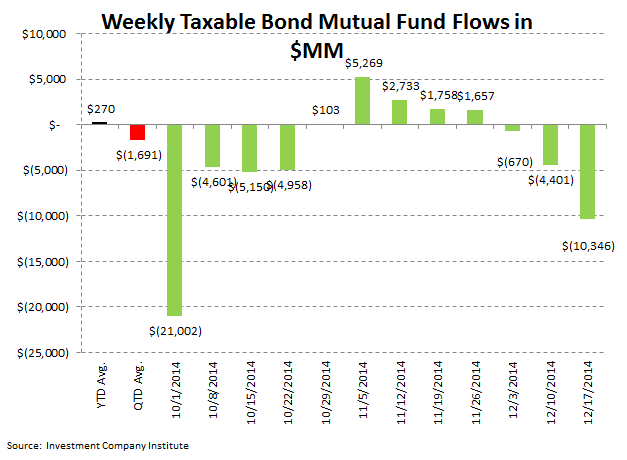
Fixed income mutual funds put up outflows of $9.4 billion with $10.3 billion of outflows from taxable funds offset by $950 million of inflows into tax-free funds. Munis have had a solid year with subscriptions in 48 of the past 50 weeks. The 2014 weekly average for fixed income mutual funds now stands at an $804 million weekly inflow, an improvement from 2013's weekly average outflow of $1.3 billion, but still a pittance of the weekly average of +$5.8 billion in 2012 (our view of the blow off top in bond fund inflow).
ETF results were mixed; equity ETFs put up a $5.8 billion outflow, well below the the 2014 weekly average of a $2.6 billion inflow. Fixed income ETFs, however, put up a $3.8 billion inflow, well above the year-to-date average of a $1.1 billion inflow.
Mutual fund flow data is collected weekly from the Investment Company Institute (ICI) and represents a survey of 95% of the investment management industry's mutual fund assets. Mutual fund data largely reflects the actions of retail investors. Exchange traded fund (ETF) information is extracted from Bloomberg and is matched to the same weekly reporting schedule as the ICI mutual fund data. According to industry leader Blackrock (BLK), U.S. ETF participation is 60% institutional investors and 40% retail investors.
Most Recent 12 Week Flow in Millions by Mutual Fund Product: Chart data is the most recent 12 weeks from the ICI mutual fund survey and includes the running weekly year-to-date average for 2014 and the weekly quarter-to-date average for 4Q 2014:


Most Recent 12 Week Flow Within Equity and Fixed Income Exchange Traded Funds: Chart data is the most recent 12 weeks from Bloomberg's ETF database (matched to the Wednesday to Wednesday reporting format of the ICI) and the running weekly year-to-date average for 2014 and the weekly quarter-to-date average for 4Q 2014. The third table are the results of the weekly flows into and out of the major market and sector SPDRs:


Sector and Asset Class Weekly ETF and Year-to-Date Results: In sector SPDR callouts, the the XLB materials ETF experienced a reversal from the prior week, losing 9% or $288 million in withdrawals. The XLY Consumer discretionary experienced the largest flow on a percentage bases at a +10% (+$738 million inflow).

Net Results:
The net of total equity mutual fund and ETF trends against total bond mutual fund and ETF flows totaled a negative $6.8 billion spread for the week ($12.4 billion of total equity outflow versus the $5.6 billion outflow from fixed income; positive numbers imply greater money flow to stocks; negative numbers imply greater money flow to bonds). The 52 week moving average has been $1.8 billion (more positive money flow to equities), with a 52 week high of $17.7 billion (more positive money flow to equities) and a 52 week low of -$37.5 billion (negative numbers imply more positive money flow to bonds for the week).

Exposures: The weekly data herein is important for the public asset managers with trends in mutual funds and ETFs impacting the companies with the following estimated revenue impact:

Jonathan Casteleyn, CFA, CMT
Joshua Steiner, CFA
