

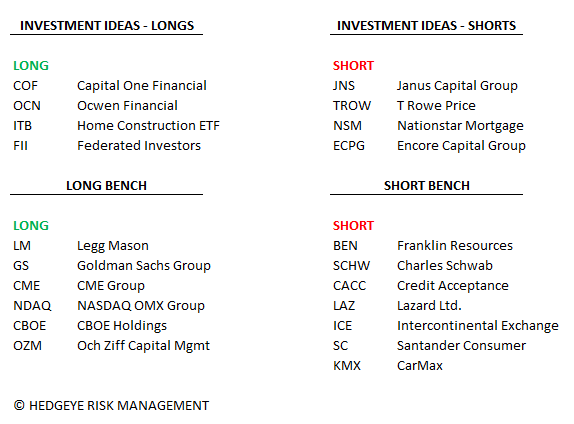
Current Ideas:
Key Takeaway:
Last week saw another wild ride as the market entered the week with rising concerns about the fallout of falling oil and a potential Russian collapse, but exited the week on a higher note in response to the Fed and ECB talking about delaying rate hikes and potentially purchasing assets, respectively. The XLF closed +2% on the week while most of the CDS gauges, on average, ended little changed on the week.
Looking ahead, headwinds prevail. Rising concerns around credit quality fallout in oil-sensitive areas are coupled to ongoing pressure in yield spreads. Translation: rising revenue pressure in conjunction with growing provision expense.
Financial Risk Monitor Summary
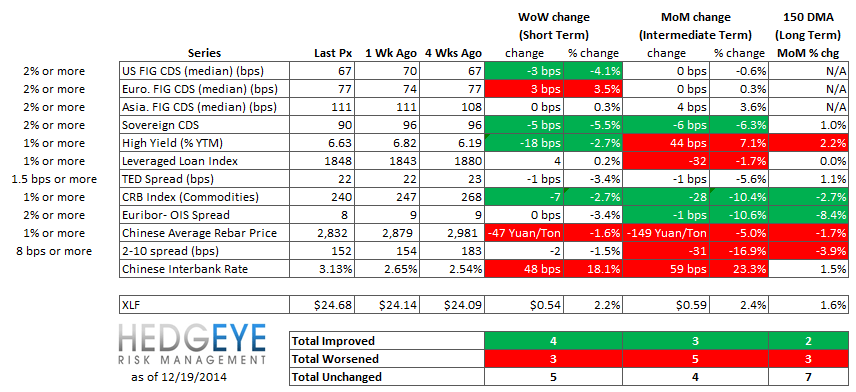
• Short-term(WoW): Positive / 4 of 12 improved / 3 out of 12 worsened / 5 of 12 unchanged
• Intermediate-term(WoW): Negative / 3 of 12 improved / 5 out of 12 worsened / 4 of 12 unchanged
• Long-term(WoW): Negative / 2 of 12 improved / 3 out of 12 worsened / 7 of 12 unchanged
1. U.S. Financial CDS - Swaps tightened for 21 out of 27 domestic financial institutions as the stock market rose on news that the Federal Reserve would not raise interest rates in the near future. Of institutions whose CDS widened, Genworth Financial widened the most (+30 bps) on its announcement that it has not yet completed its annual review of long-term care insurance active life margins.
Tightened the most WoW: PRU, MTG, ACE
Widened the most WoW: GNW, MBI, AGO
Tightened the most WoW: MMC, ACE, CB
Widened the most MoM: GNW, AGO, GS

2. European Financial CDS - Swaps mostly widened in Europe last week, but results were somewhat mixed. 15 institutions' CDS tightened while 21 widened. Russia's Sberbank CDS continued to widen, increasing by 16 bps. Sberbank's risk profile is well into the red with CDS at 583 bps.

3. Asian Financial CDS mostly widened last week with Japan's Sumitomo Mitsui leading the group (+3 bps, +4.9%). Chinese CDS showed the smallest moves, which contrasts danger signals shown elsewhere such as the interbank rate, which rose +48 bps, and the price of Chinese steel, which fell -1.6% during the week.

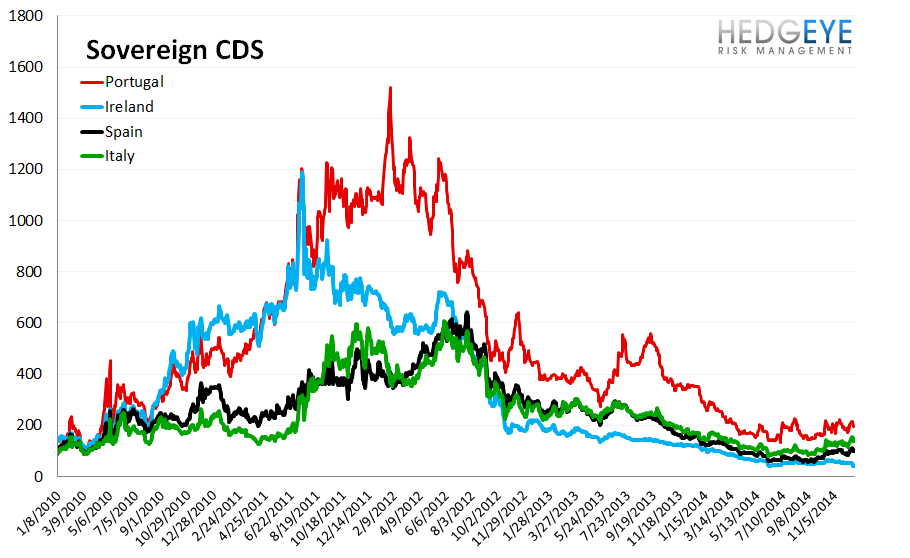
4. Sovereign CDS – Sovereign swaps mostly tightened over last week, particularly across Europe. The catalyst for tightening was the Fed signaling it would not raise rates in the near future, and the ECB signaling it is ready to pursue asset purchases.


5. High Yield (YTM) Monitor – High Yield rates fell 18.5 bps last week, ending the week at 6.63% versus 6.82% the prior week.

6. Leveraged Loan Index Monitor – The Leveraged Loan Index rose 5.0 points last week, ending at 1848.

7. TED Spread Monitor – The TED spread fell 0.8 basis points last week, ending the week at 21.7 bps this week versus last week’s print of 22.49 bps.

8. CRB Commodity Price Index – The CRB index fell -2.7%, ending the week at 240 versus 247 the prior week. As compared with the prior month, commodity prices have decreased -10.4% We generally regard changes in commodity prices on the margin as having meaningful consumption implications.

9. Euribor-OIS Spread – The Euribor-OIS spread (the difference between the euro interbank lending rate and overnight indexed swaps) measures bank counterparty risk in the Eurozone. The OIS is analogous to the effective Fed Funds rate in the United States. Banks lending at the OIS do not swap principal, so counterparty risk in the OIS is minimal. By contrast, the Euribor rate is the rate offered for unsecured interbank lending. Thus, the spread between the two isolates counterparty risk. The Euribor-OIS spread was unchanged at 8 bps.

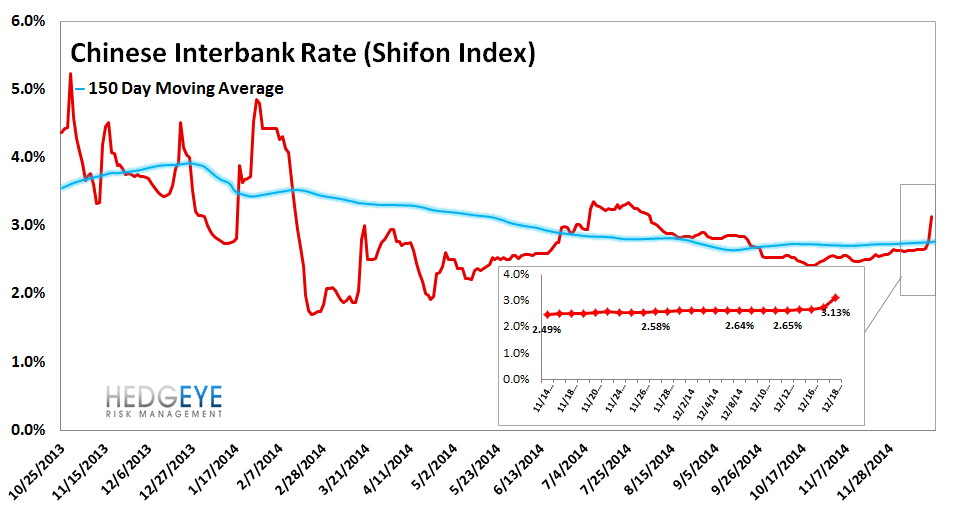
10. Chinese Interbank Rate (Shifon Index) – The Shifon Index rose 48 basis points last week, ending the week at 3.13% versus last week’s print of 2.65%. The Shifon Index measures banks’ overnight lending rates to one another, a gauge of systemic stress in the Chinese banking system.
11. Chinese Steel – Steel prices in China fell 1.6% last week, or 47 yuan/ton, to 2832 yuan/ton. We use Chinese steel rebar prices to gauge Chinese construction activity, and, by extension, the health of the Chinese economy.

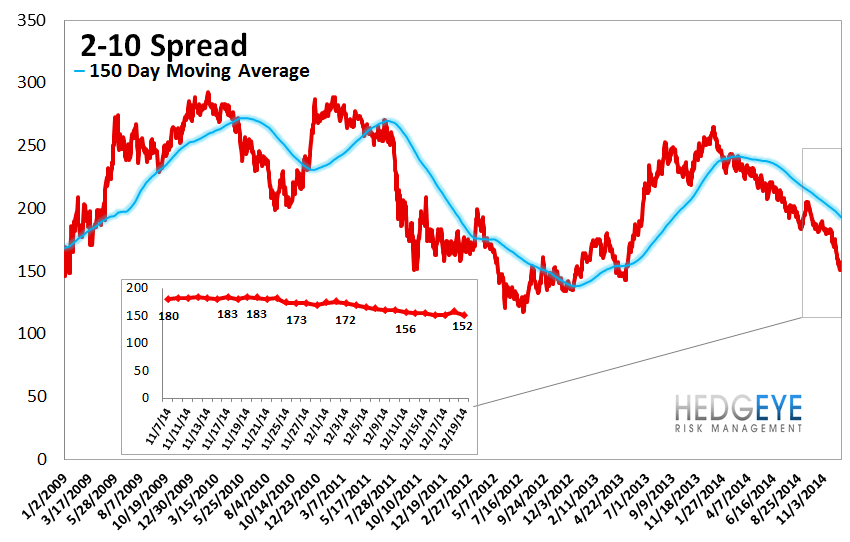
12. 2-10 Spread – Last week the 2-10 spread tightened to 152 bps, -2 bps tighter than a week ago. We track the 2-10 spread as an indicator of bank margin pressure.
13. XLF Macro Quantitative Setup – Our Macro team’s quantitative setup in the XLF shows 2.0% upside to TRADE resistance and 1.1% downside to TRADE support.

Joshua Steiner, CFA
Jonathan Casteleyn, CFA, CMT
