

Investment Company Institute Mutual Fund Data and ETF Money Flow:
Broad themes relayed throughout 2014 have not changed with an ongoing redemption in the domestic equity mutual fund channel and stubborn strength in fixed income. With another 3.0 billion lost last week in U.S. stock funds, the 30th week of outflow in the past 32 weeks, we remain cautious on shares of T Rowe Price (TROW) and Janus Capital (JNS). Conversely with the more defensive nature of recent market trends and the 7th consecutive week of inflows into money market funds, which have totaled over $79 billion, we highlight our newest Long idea Federated Investors (FII).
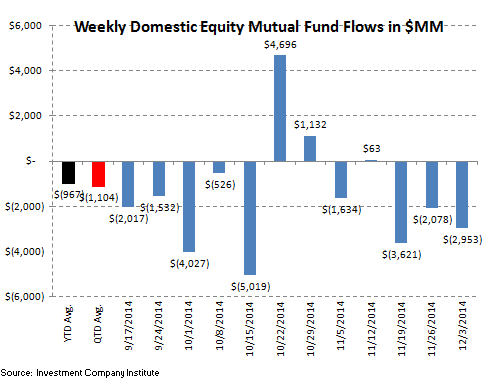
In the most recent 5 day period ending December 3, total equity mutual funds put up net outflows of $2.7 billion according to the Investment Company Institute. The outflow was composed of domestic stock fund withdrawals of $3.0 billion versus the $271 million subscription into international stock funds. The international and domestic equity categories continue to be polarized with international stock funds having inflows in 46 of the past 48 weeks, versus domestic trends which have been very soft with inflow in just 16 of the past 48 weeks. This data continues to be supportive of our underweight or short recommendations on the U.S. centric equity asset managers (see our research here). The running year-to-date weekly average for all equity fund flow continues to decline and now settles at a $936 million inflow, well below the $3.1 billion weekly average inflow from 2013.
Fixed income mutual funds put up inflows of $174 million with $667 million of outflows in taxable funds and $841 million of inflows in tax-free funds. Munis have had a solid run with subscriptions in 46 of the past 47 weeks. The 2014 weekly average for fixed income mutual funds now stands at a $1.1 billion weekly inflow, an improvement from 2013's weekly average outflow of $1.3 billion, but still a pittance of the weekly average of +$5.8 billion in 2012 (our view of the blow off top in bond fund inflow).
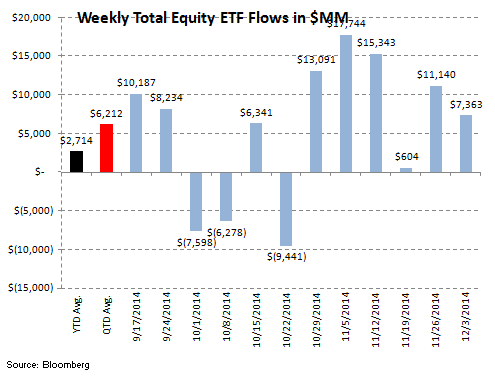
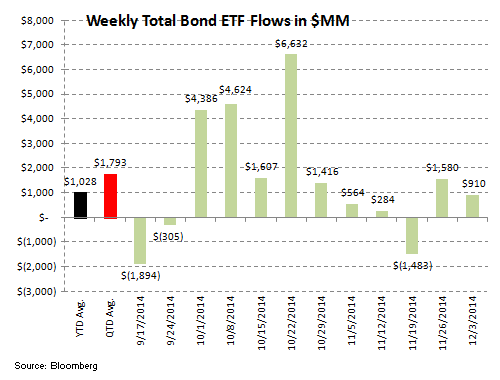
ETF results were strong during the most recent 5 days with substantial inflows into equities and decent subscriptions into passive fixed income products. Equity ETFs put up a $7.4 billion inflow which is above the 2014 weekly average of a $2.7 billion inflow. Fixed income ETFs netted $910 million in new investor funds, slightly below the year-to-date average of $1.0 billion.
Mutual fund flow data is collected weekly from the Investment Company Institute (ICI) and represents a survey of 95% of the investment management industry's mutual fund assets. Mutual fund data largely reflects the actions of retail investors. Exchange traded fund (ETF) information is extracted from Bloomberg and is matched to the same weekly reporting schedule as the ICI mutual fund data. According to industry leader Blackrock (BLK), U.S. ETF participation is 60% institutional investors and 40% retail investors.

Most Recent 12 Week Flow in Millions by Mutual Fund Product: Chart data is the most recent 12 weeks from the ICI mutual fund survey and includes the running weekly year-to-date average for 2014 and the weekly quarter-to-date average for 4Q 2014:


Most Recent 12 Week Flow Within Equity and Fixed Income Exchange Traded Funds: Chart data is the most recent 12 weeks from Bloomberg's ETF database (matched to the Wednesday to Wednesday reporting format of the ICI) and the running weekly year-to-date average for 2014 and the weekly quarter-to-date average for 4Q 2014. The third table are the results of the weekly flows into and out of the major market and sector SPDRs:
Sector and Asset Class Weekly ETF and Year-to-Date Results: In sector SPDR callouts, investors rebounded the energy sector with the XLE taking in +$740 million or an 8% increase in total assets for the week. The second biggest mover on the downside, was the materials XLB, with investors withdrawing $189 million or 6% of total assets.

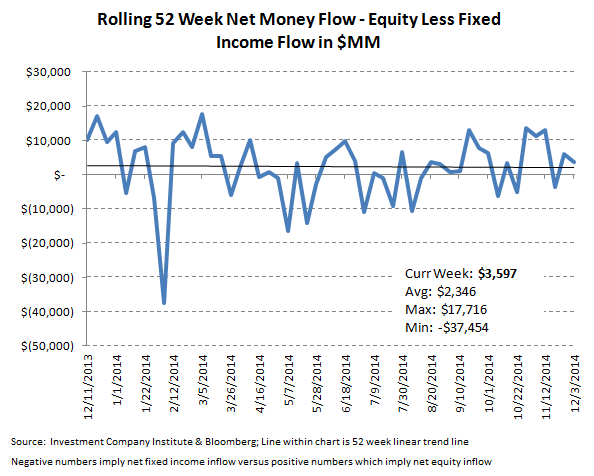
Net Results:
The net of total equity mutual fund and ETF trends against total bond mutual fund and ETF flows totaled a positive $3.6 billion spread for the week ($4.7 billion of total equity inflow versus the $1.1 billion inflow within fixed income; positive numbers imply greater money flow to stocks; negative numbers imply greater money flow to bonds). The 52 week moving average has been $2.3 billion (more positive money flow to equities), with a 52 week high of $17.7 billion (more positive money flow to equities) and a 52 week low of -$37.5 billion (negative numbers imply more positive money flow to bonds for the week).
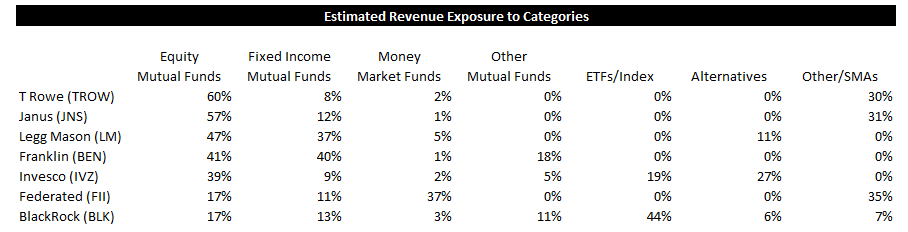
Exposures: The weekly data herein is important for the public asset managers with trends in mutual funds and ETFs impacting the companies with the following estimated revenue impact:
Jonathan Casteleyn, CFA, CMT
Joshua Steiner, CFA
