
Note: Using the z-score in the tables below as a coefficient of variation for standard error helps us flag the relative market positioning of the commodities in the CRB Index. It is not intended as a predictive signal for the reversion to trailing twelve month historical averages. For week-end price data, please refer to “Commodities: Weekly Quant” published at the end of the previous week. Feel free to ping us for additional color.
------
1. CFTC Net Futures and Options Positioning CRB Index: The Commodities Futures Trading Commission (CFTC) releases “Commitments of Traders Reports” at 3:30 p.m. Eastern Time on Friday. The release usually includes data from the previous Tuesday (Net Positions as of Tuesday Close), and includes the net positions of “non-commercial” futures and options participants. A “Non-Commercial” market participant is defined as a “speculator.” We observe the weekly marginal changes in the overall positioning of “non-commercial” futures and options positions to assess the directionally-biased capitulation risk among those with large, speculative positions.
- The ORANGE JUICE, COTTON, AND WHEAT markets experienced the most BULLISH relative positioning changes week-over-week
- The SUGAR, SOYBEANS, AND HEATING OIL markets experienced the most BEARISH relative positioning changes week-over-week

2. Spot – Second Month Basis Differential: Measures the market expectation for forward looking prices in the near-term.
- The CORN, SUGAR, ORANGE JUICE markets are positioned for HIGHER PRICES near-term
- The WHEAT, LEAN HOGS, COCOA markets are positioned for LOWER PRICES near-term

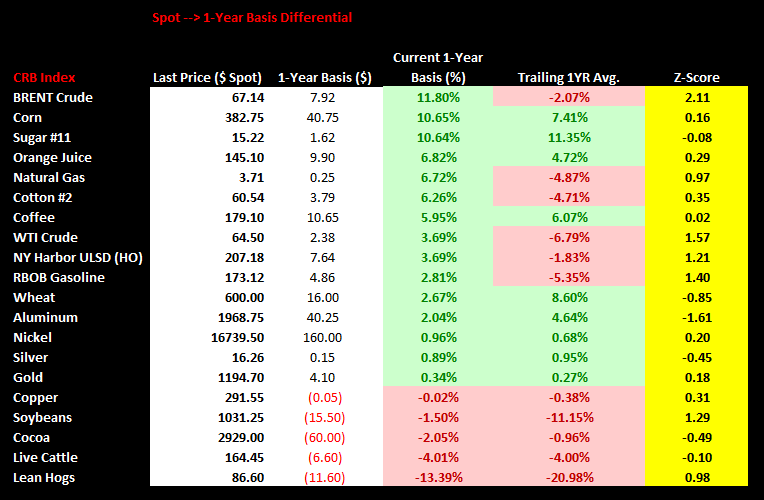
3. Spot – 1 Year Basis Differential: Measures the market expectation for forward-looking prices between spot and the respective contract expiring 1-year later.
- The BRENT, CORN, AND SUGAR markets are positioned for HIGHER PRICES in 1-year
- The LEAN HOGS LIVE CATTLE, AND COCOA markets are positioned for LOWER PRICES in 1-year
*NOTE* Despite the sell-off in crude oil since the middle of the summer, the futures curve has become much steeper. Jan. 2016 BRENT contracts have widened relative to spot prices. The spot price-1yr differential has widened from around $1.00 at the beginning of October to over $5.00 currently ($5.23 currently). BRENT spot-1Yr. basis differential is the widest of any commodities in the CRB Commodities Index (Jan 2016 contracts are trading nearly +12% higher than Jan 2015 contracts (current spot). Despite the downward pressure on spot prices, the contango in the current curve will provide support to the upside on the expiry roll if the general shape remains the same.
4. Open Interest: Aggregate open interest measures the amount of opened positions in all actively traded futures contract months. Open interest can be thought of as “naked” or “directionally-biased” contracts as opposed to hedgers scalping and providing liquidity. Most of the open interest is created from large speculators or participants who are either: 1) Producers/sellers of the physical commodity hedging their cash market exposure or 2) Large speculators who are directionally-biased on price.

Ben Ryan
Analyst
