Our Hedgeye Housing Compendium table (below) aspires to present the state of the housing market in a visually-friendly format that takes about 30 seconds to consume.

Today's Focus: October CoreLogic Home Price Report
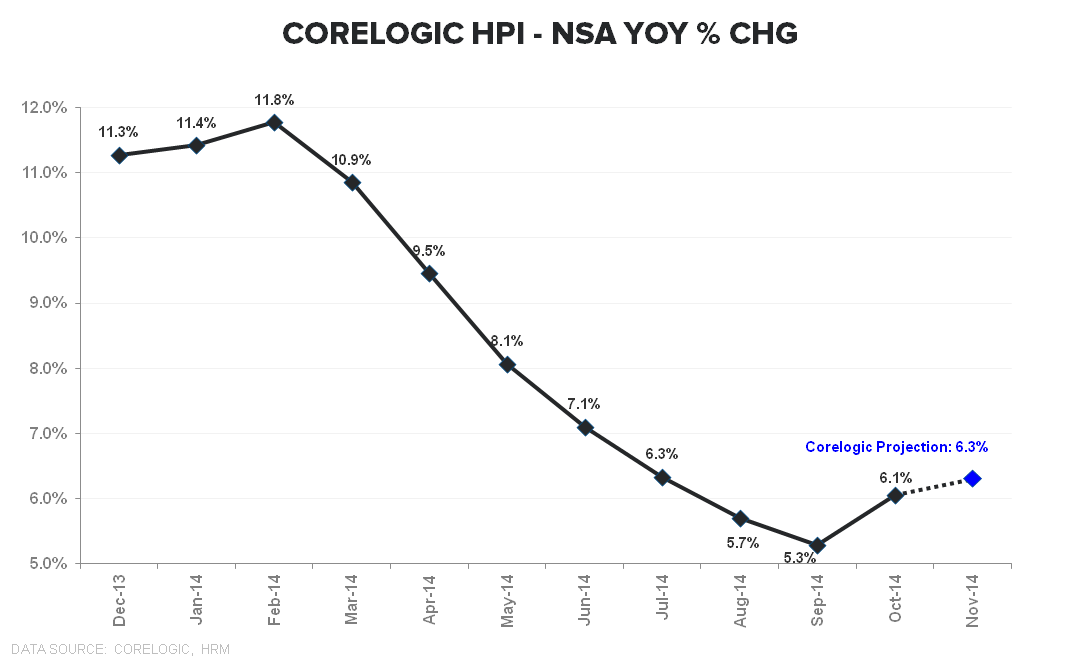
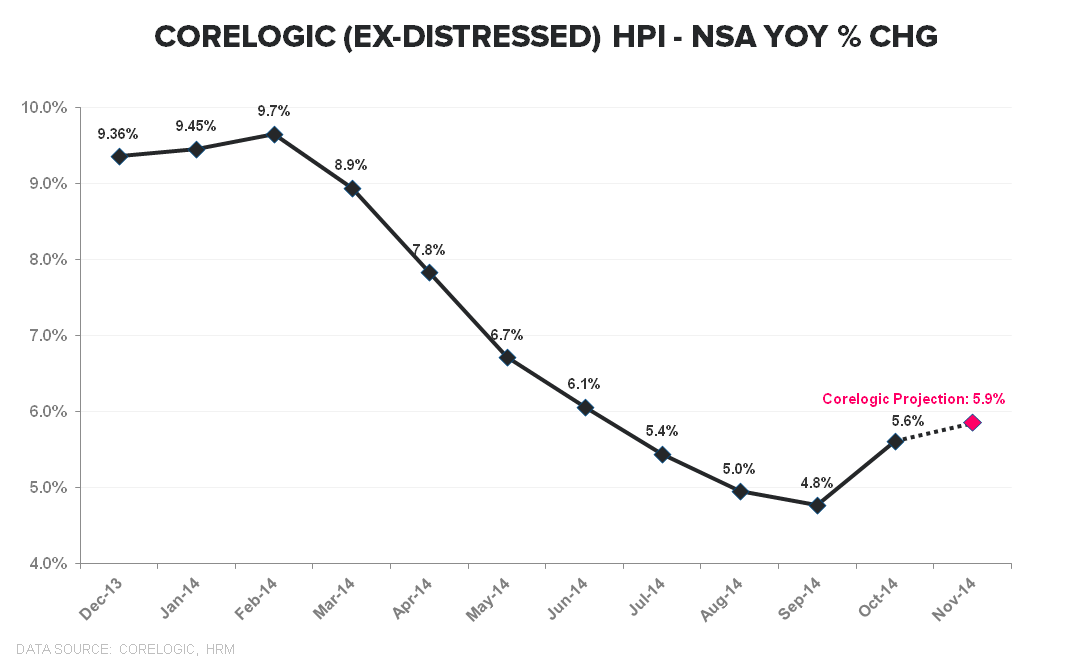
Corelogic Home price data for October released this morning showed home prices growing +6.1% YoY – a sequential acceleration relative to the +5.3% rate of appreciation reported last month. Price trends in the Ex-Distressed series were similar, accelerating to +5.6% YoY from +4.8% in September. The short-term projections for November are calling for further acceleration to +6.3% and +5.9% in the national and ex-distressed series, respectively.
The Dilemma…Resolved? Back on 9/2, we put out a note titled: THE DILEMMA where we considered the reported stabilization in home price growth for the Jun/July period in the context of the change in CoreLogic's HPI estimate methodology and the rise in magnitude of estimate revisions in 2014.
Our conclusion was that the emerging stabilization in 2nd derivative HPI – the trend of which is central to our top down view on the directional outlook for housing (see last week's note: INFLECTION INSPECTION for a summary review of our top-down model) – warranted more caution on remaining bearish but that we were content to await confirmatory data, both from CoreLogic and the other primary home price series.
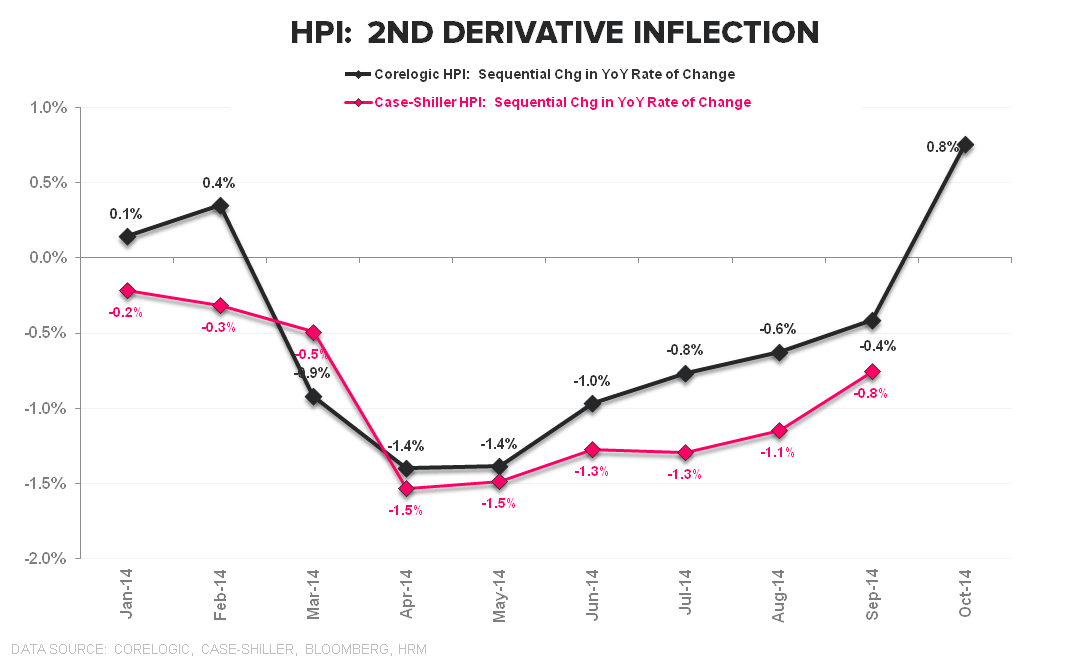
While the subsequent data was, indeed, revised to reflect ongoing price deceleration, the trend across the CoreLogic, Case-Shiller, and FHFA series have shown a gradual slowdown in the sequential rate of year-over-year price deceleration over the last two-to-three months.
*The important takeaway is that what was a fledgling stabilization in HPI trends is now showing a nascent shift towards stabilization/acceleration. Historically, housing related equities have followed the slope in price growth, so an inflection in pricing would sit as a discrete positive for the complex. We’re still a bit weary of a single month of CoreLogic data in isolation but the multi-month stabilization in price growth across HPI series suggests the shift is more legitimate than not.

About CoreLogic:
CoreLogic HPI incorporates more than 30 years worth of repeat sales transactions, representing more than 55 million observations sourced from CoreLogic's property information database. The CoreLogic HPI provides a multi-tier market evaluation based on price, time between sales, property type, loan type (conforming vs. nonconforming), and distressed sales. The CoreLogic HPI is a repeat-sales index that tracks increases and decreases in sales prices for the same homes over time, which provides a more accurate constant-quality view of pricing trends than basing analysis on all home sales. The CoreLogic HPI covers 6,208 ZIP codes (58 percent of total U.S. population), 572 Core Based Statistical Areas (85 percent of total U.S. population) and 1,027 counties (82 percent of total U.S. population) located in all 50 states and the District of Columbia."
Joshua Steiner, CFA
Christian B. Drake