CHART OF THE DAY: PCE Growth vs. Disposable Personal Income Growth & Change in Savings Rate

11/28/14 07:29AM EST

CHART OF THE DAY: PCE Growth vs. Disposable Personal Income Growth & Change in Savings Rate - EL Chart2

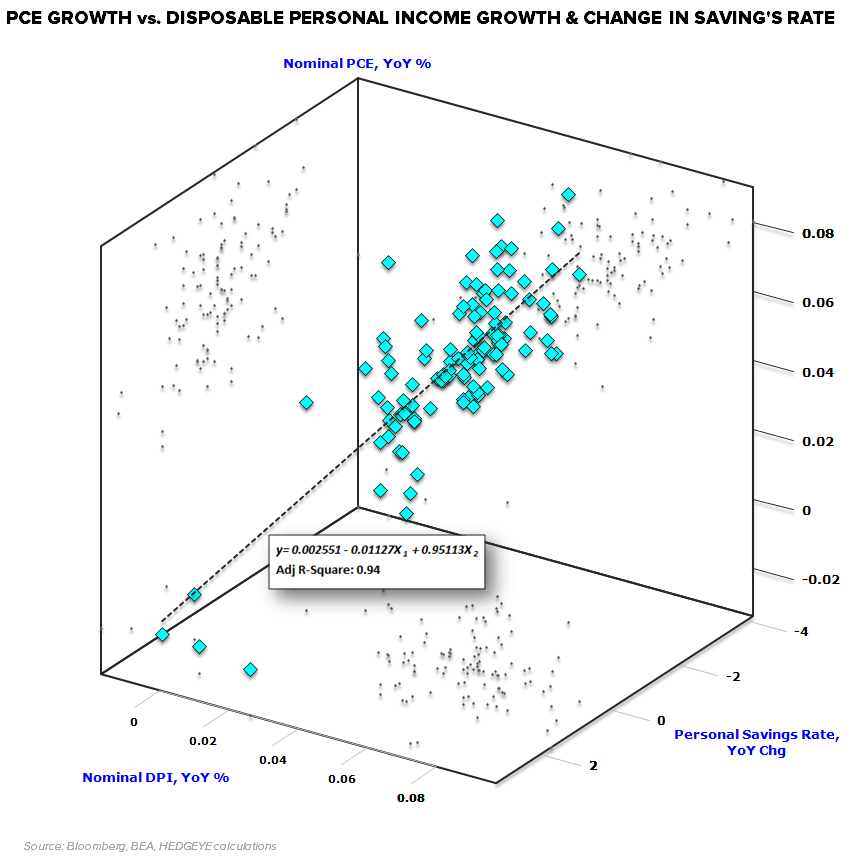
As the 3-D scatterplot below shows, the multiple regression between Disposable Personal Income growth and the change in the Savings Rate (independent variables) vs. the change in Consumer Spending (dependent variable) has an R-square of 0.95 across decades of data. More simply, growth in Disposable Income and the change in the Savings Rate explains ~95% of the change in aggregate household spending.


As we distilled it in our institutional note on Friday:

If ya don’t have it (no savings), ya ain’t gettin it (wages), and ya ain’t borrowing it (credit)…ya can’t spend it (PCE).

© 2024 Hedgeye Risk Management, LLC. The information contained herein is the property of Hedgeye, which reserves all rights thereto. Redistribution of any part of this information is prohibited without the express written consent of Hedgeye. Hedgeye is not responsible for any errors in or omissions to this information, or for any consequences that may result from the use of this information.