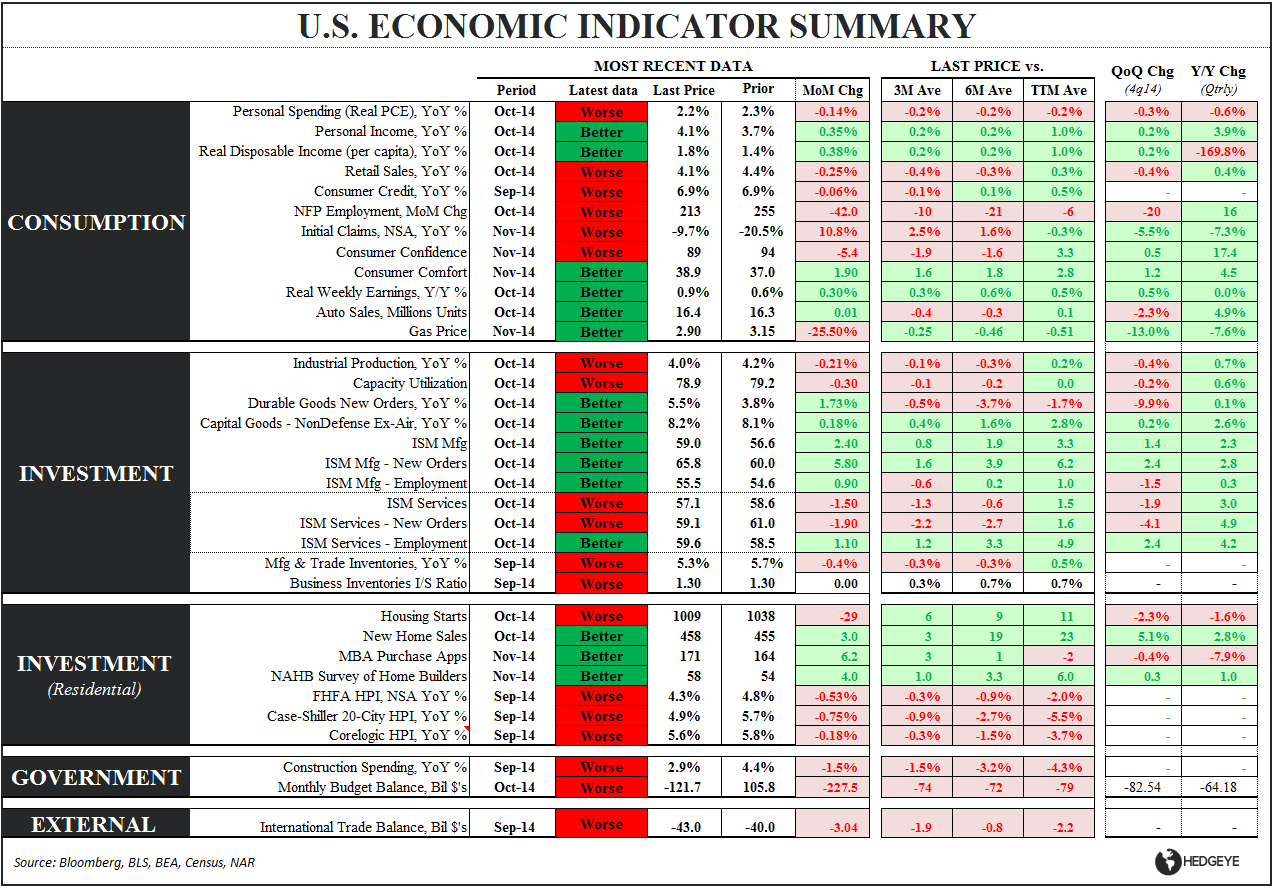
IN SHORT: Initial Claims deteriorated for a 3rd week, Durable and Capital Goods spending softened (again), and Household Spending and Income did a whole ‘lotta not much (with a notable negative revision). We parse each of the releases below.
INCOME & SPENDING (Oct.): And like that, it was gone…..
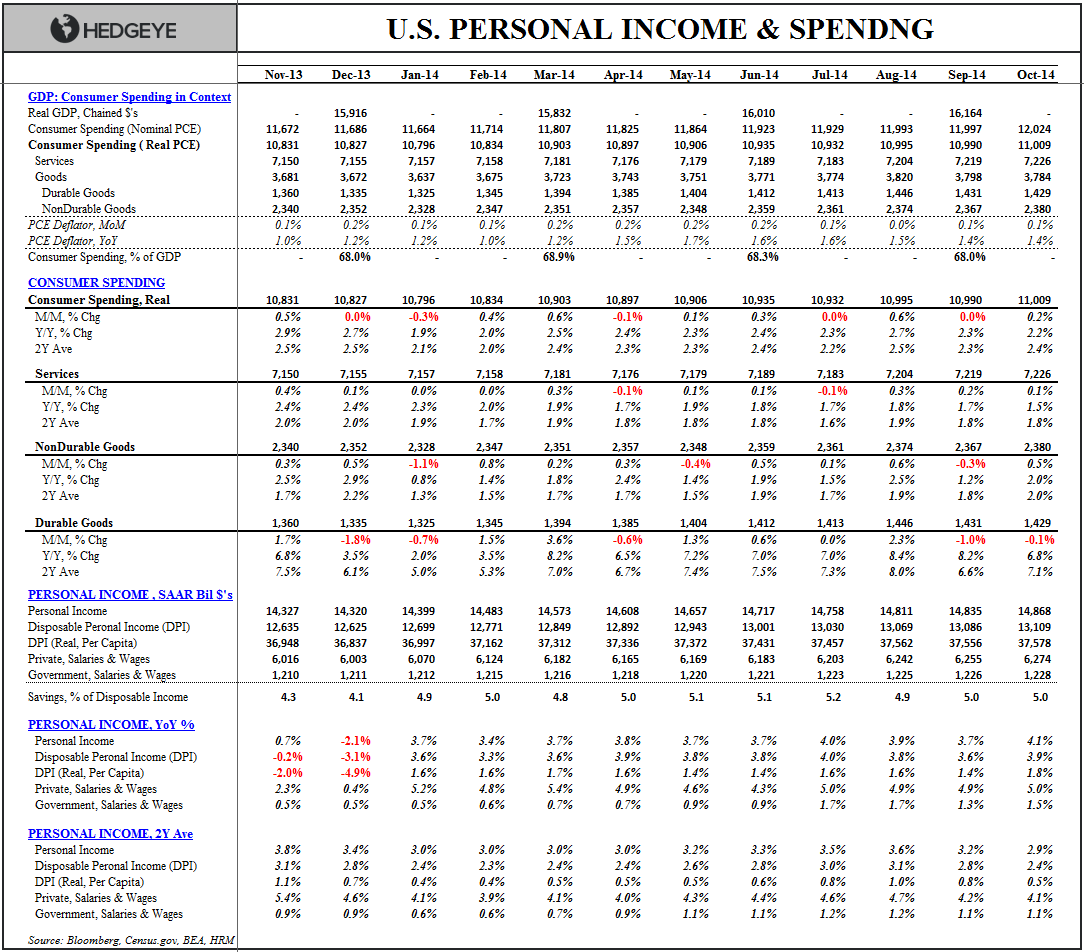
Spending: Another middling month for domestic consumerism with real spending rising +0.2% sequentially against a +0.0% comp. Total Spending growth decelerated -10bps sequentially to +2.2% YoY and accelerated +10bps on a 2Y ave growth basis.
Spending on Services was flat sequentially while NonDurables spending growth accelerated on a MoM/1Y/2Y. Notably, spending on Durables was negative MoM for a 2nd month and decelerated further on a YoY basis.
Revolving consumer credit growth broke out of its 3Y slumber in 2Q alongside accelerated spending on durables and the two have moved in lockstep the last 6 months. It’s likely card spending moderates alongside the moderation in higher ticket discretionary consumption.


Income: Estimates for personal income were revised for the April-to-September period and the PCE figures were revised for the July-to-September period. The adjustments were noteworthy as total disposable income gains were revised down significantly with the net impact being downward revisions to both wage and income growth and the savings rate.
As can be seen in the 1st chart below, while aggregate private sector wage growth ticked up sequentially and remains near post-recession highs, the slope of wage growth in 2Q/3Q goes from one of acceleration to one of flat-to-modest deceleration after the revision.
A holiday Salute to Simplicity: Growth in Disposable Income and the change in the Savings Rate explains ~95% of the change in household spending (i.e the multiple regression b/w DPI growth & the chg in the savings rate vs. Chg in PCE has an R-square of 0.95).
If ya ain’t got it (wages), and ya ain’t borrowing it (credit)…ya can’t spend it (PCE).
And in a modern, Keynesian consumption economy, it’s the “spendin it” that counts.
Macro can be as made as nuanced and complex as one wishes and the alpha, of course, is in correctly forecasting that change in growth/income, but it’s worth re-remembering that the trajectory of an economy boils down to some simple realities.


INITIAL CLAIMS: Past Peak?
SA: Headline claims rose +21K sequentially to +313K, marking the first week above the +300K level in 11 weeks. Seasonally adjusted rolling claims increased +6K WoW to +294K, marking a 3rd week of deterioration (not overly unexpected given the comp setup) and the highest level in 2 months.
NSA: The rate of improvement in non-seasonally adjusted claims deteriorated to -3.6% YoY (vs -12.53% prior) while the 4-week rolling average, which we consider a more accurate representation of the underlying labor market trend, slowed for the 5th straight week, decelerating -330bps to -12.7% YoY.
CYCLE ACCOUNTING: As we’ve highlighted, historical cycle precedents suggest peak improvement in initial claims (3Mo rolling ave basis) consistently occurs ~7months before the peak in the economic cycle.
It’s been our contention, from a fundamental view of the labor market data, that while an economic peak isn’t immediately imminent, the trough is currently being put in and once the inflection occurs the ticking of the clock gets increasingly louder – particularly when the ~330K level gets re-breached to the upside.
Its also worth re-highlighting that while peak improvement in claims has been a consistently good lead indicator for the economic cycle, using it to time the market cycle has proven more dubious – particularly in recent cycles where market peaks have occurred quasi- coincident with the trough in claims.


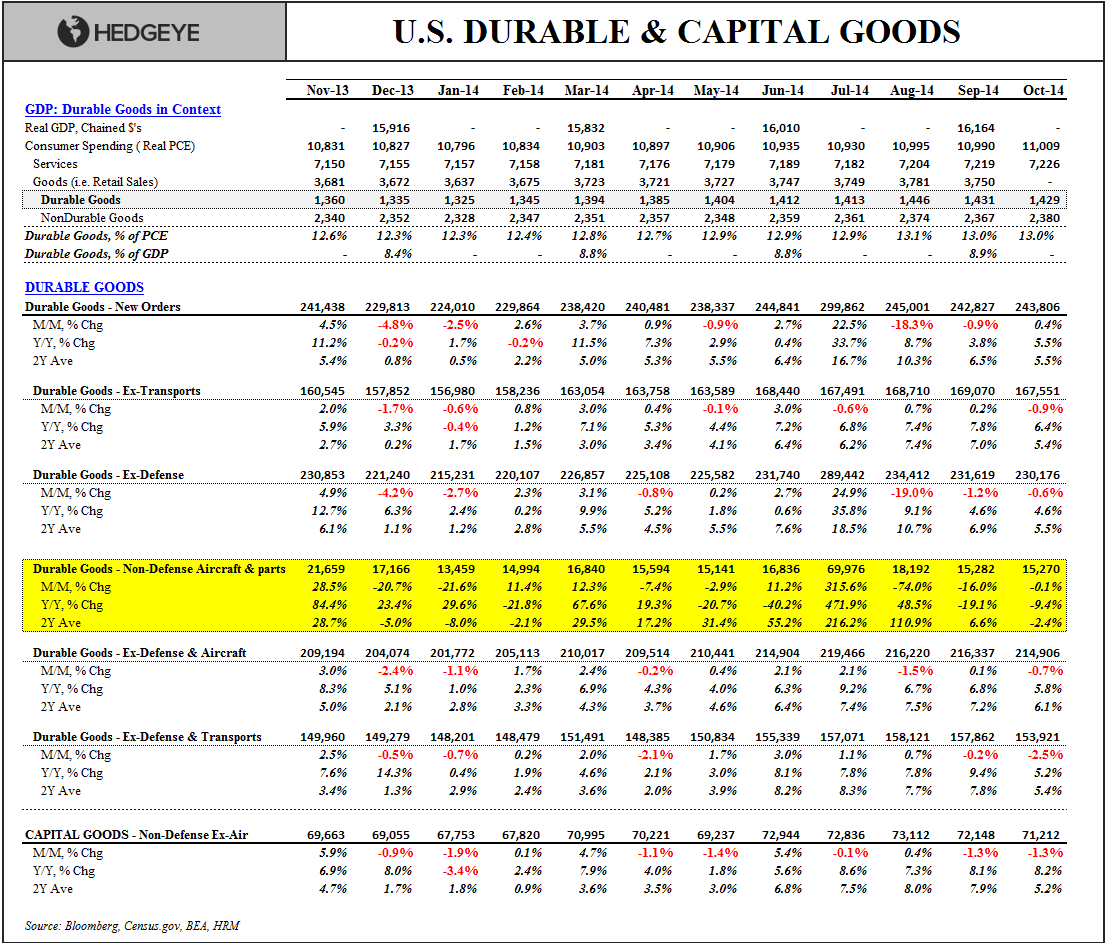
DURABLE GOODS: A Second Month of Softness
The Headline was a bit more flattering than the core with total new durable goods orders rising +0.4% MoM (against a -0.9% comp) and accelerating on a YoY basis. However, for a 2nd month, almost every sub-aggregate reported negative MoM growth with most decelerating on a year-over-year and 2Y ave basis as well.
Durables Ex Defense & Aircraft - the goods the ave household buys – declined -0.7% MoM and decelerated on both a 1Y and 2Y. On the business demand side, Core Capital Goods declined a sizeable -1.3% MoM for a second consecutive month and has now been negative for 7 of the last 12 months.


A Quick Look Globally: For the last couple quarters we’ve suggested both fundamental trends and market prices were heralding slowing growth, disinflation and a move into what we refer to as Quad #4.
Domestically, the inflation, spending and manufacturing data is slowing from a second derivative perspective into 4Q but the convergence to slower growth and transition into Quad 4 has been global.
Below is our “Global Macro for Dummies” table which consolidates global estimate trends for growth and inflation. One need only observe the ubiquitous red (i.e. negative growth/inflation estimate revisions) to see the Quad 4 reality manifesting in real-time.
Until we see the slope of growth inflect and market prices confirm, we’ll remain better sellers of strength in equities and buyers of the long bond on weakness.

Christian B. Drake
@HedgeyeUSA