

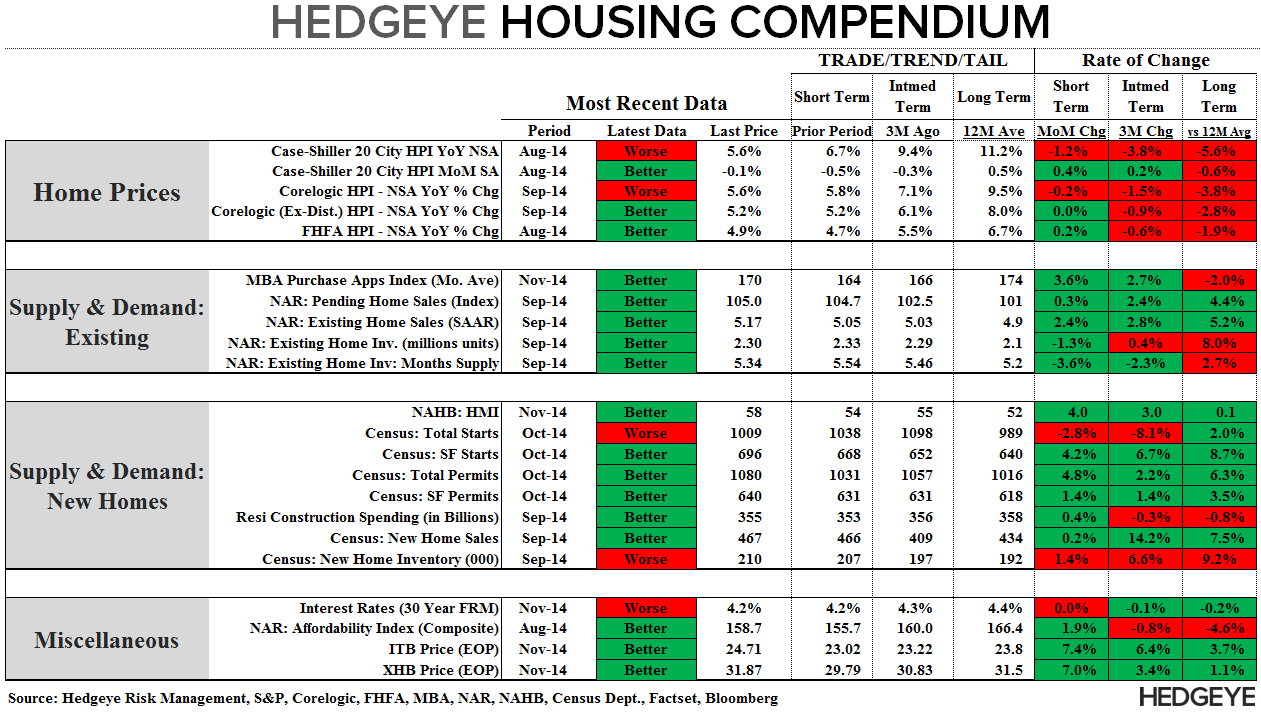
Our Hedgeye Housing Compendium table (below) aspires to present the state of the housing market in a visually-friendly format that takes about 30 seconds to consume.
*Note - to maintain cross-metric comparability, the purchase applications index shown in the table below represents the monthly average as opposed to the most recent weekly data point.
BOTTOM LINE - THE CALL HAS BEEN WORKING BUT THE DATA'S TURNING
We'll reiterate today what we wrote yesterday when assessing the NAHB HMI data. Our bearish call on housing thus far in 2014 has been playing out as the XHB remains the worst performing sector YTD. That said, many of the negative dynamics that we flagged earlier this year have largely or completely played out and we're now seeing some signs of light at the end of the tunnel (see the volume of "green" in the compendium at the top of this note). We'll be hosting a call in early December to update our views on housing heading into 2015.
Today's Focus: October Housing Starts & Permits & MBA Mortgage Apps
October Housing Starts & Permits
The Census Bureau released its monthly Housing Starts & Permits data for October this morning.
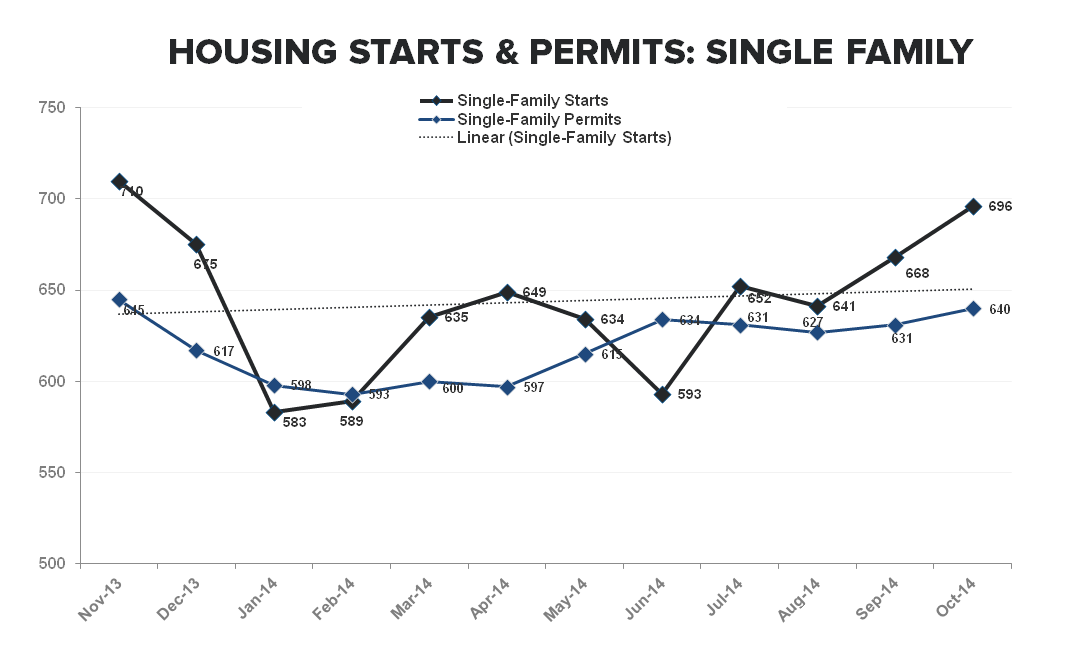
Total New Home Starts declined -29K (-2.8%) sequentially in October while Permits rose +49K (+4.8%) to 1.080M SAAR– the highest level since June of 2008. In contrast to last month, the headline is less flattering than the core as single family starts showed a second month of (modest) positive mojo.
Single Family starts rose +28K (+4.2%) to +696K, the highest level in a year and the second month above the TTM Trend. The September figures also saw a +22K positive revision up to +668K from +646K. Permits, however, continue to meander with SF permits up just +9K to +640K in October, extending the flat YTD trend and diverging from starts the last two months. The two, of course, are invariably tethered so we can expect some measure of re-coupling in the coming months.
Two months do not (yet) a trend make and we’re interested to see in which direction the burgeoned divide between actual construction activity and builder confidence corrects in favor of against a 2015 backdrop of easier compares, looser regulation and ongoing improvement in the labor market (and the 20-34YOA demographic in particular).
On the multi-family side, starts declined -57K MoM (-15.4%) to +313K while permits rose +40K (+10%) to +440K. Given the volatility in the multi-family data on a month-to-month basis, we look more to the trend and with single-family starts up +4.5% YoY on average YTD vs. multi-family up 19%, the concentration in construction activity, and the predominate driver of the recovery in starts, remains well defined.


MBA Mortgage Applications
The Mortgage Bankers Association today released its weekly mortgage applications survey data for the week ended November 14th.
- The Composite Index rose +4.9% in the latest week alongside a modest gain in refi activity and a remarkable pop in Purchase demand
- Purchase demand rose +11.7% WoW – the largest weekly increase in 20 months – taking the index up to 179.8, the highest level since June. Inclusive of this weeks gain, purchase activity is tracking -1.1% QoQ and -6.7% YoY (vs. -12% YoY last week). We continue to expect some measure of ongoing improvement in rate of change measures as compares ease into the last weeks of the year and take a second dive into the end of 1Q15 as the collective shock from weather, QM implementation and FHFA loan limit reductions peaked.
- Refi Activity rose for the first week in a month, gaining +0.9% sequentially as rates on the 30 FRM contract dropped a tick to 4.18%.


About Housing Starts & Permits:
The US Census Bureau records the number of new housing units that have obtained permits for construction and those that have begun construction. This data includes new buildings intended primarily as residential units. The US Census Bureau defines a start as, “Start of construction occurs when excavation begins for the footings or foundation of a building.”
About MBA Mortgage Applications:
The Mortgage Bankers’ Association’s mortgage applications index covers more than 75% of mortgage applications originated through retail and consumer direct channels. It does not include loans delivered through wholesale broker and correspondent channels. The MBA mortgage purchase applications index is considered a leading indicator of single-family home sales and construction. Moreover, it is the only housing index that is released on a weekly basis.
Frequency:
The MBA Purchase Apps index is released every Wednesday morning at 7 am EST.
Joshua Steiner, CFA
Christian B. Drake
