CHART OF THE DAY: Fed Balance Sheet Holdings vs. 10-Year Treasury Yield

11/18/14 08:13AM EST

CHART OF THE DAY: Fed Balance Sheet Holdings vs. 10-Year Treasury Yield - EL Chart  2 QE vs BS

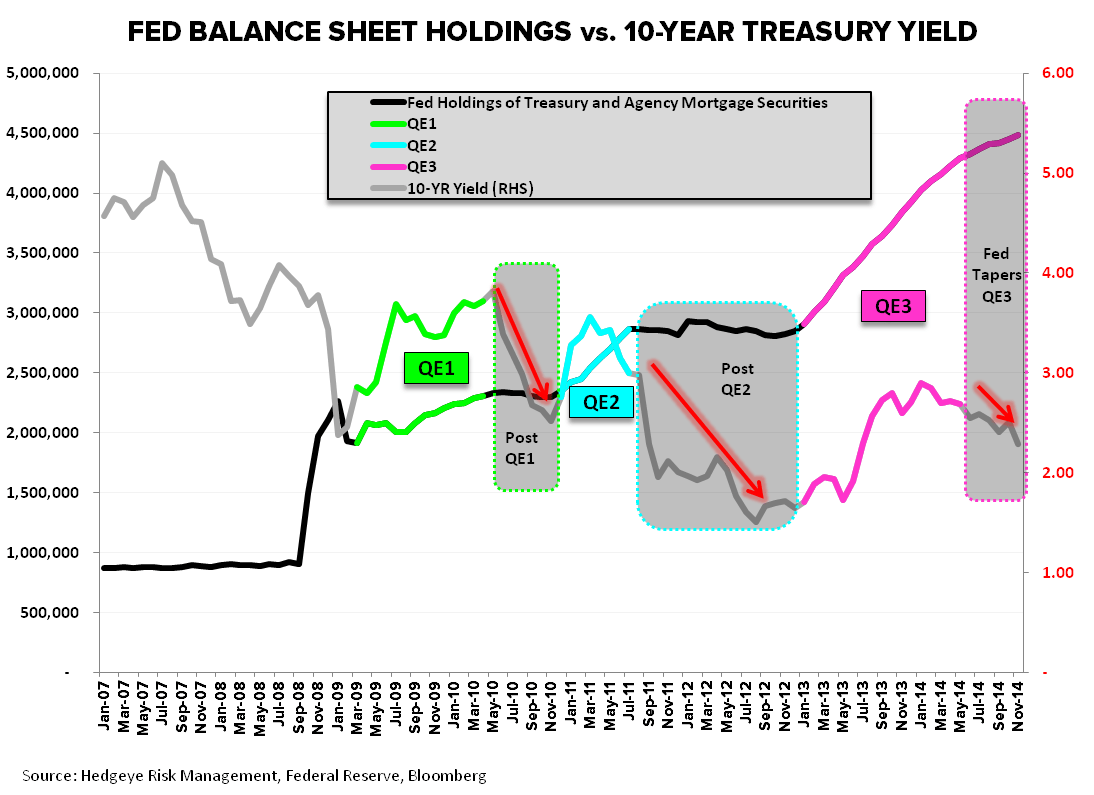
Today's Chart of the Day, first published by our Financials team early in the year, shows that the end of QE1 & QE2 were both followed by sharp drops in 10-year treasury yields as the bond market priced in slowing growth and the inability of the private sector to successfully take the hand-off from the Fed.   We’re inclined to interpret the current weakness in the 10Y as a protracted version of this recurrent cycle.  Essentially, it's the same selloff seen in the last two iterations, but in slow-motion, over the duration of the taper instead of all at once.


© 2024 Hedgeye Risk Management, LLC. The information contained herein is the property of Hedgeye, which reserves all rights thereto. Redistribution of any part of this information is prohibited without the express written consent of Hedgeye. Hedgeye is not responsible for any errors in or omissions to this information, or for any consequences that may result from the use of this information.