Relax, Bro! Its easy to go full myopia on Jobs Friday. I try my best to take a detached view of the mania.
October payrolls, with a net gain of +214K, was disappointing both vs. consensus expectations and in the context of very strong Initial claims and employment survey indices (ADP, ISM, etc).
Does a sequential slowdown in NFP signal a negative inflection in the domestic labor market – particularly given a negative birth-death drag, squirrely seasonals, a hard comp, declining slack and improving household survey metrics?
I don’t know, but that feels like a stretched read-through on a single month of data.
However, remaining willfully blind to the reality that we are late cycle and cresting from a fundamental perspective (alongside an ROW slowdown) feels equally myopic.
Thinking like a Fed Head: The prevailing view form a policy makers perspective is probably something akin to the following:
Payroll gains remain >200K and the trailing averages remain strong and the unemployment rate continues to decline (for mixed reasons) as do broader measures of labor slack.
Employment growth in the 20-35 YOA bucket is accelerating and the here-to mired 45-54 YOA bucket has had its first 4-month string of positive employment growth in the post-recession period.
Wage Inflation remains stubbornly stagnant but that's trend consistent and should improve as we move incrementally towards constrained capacity and reduced labor supply. At any rate, aggregate disposable personal income growth is accelerating and remains at post-recession highs currently.
All-in, the October payroll report (in isolation) = status quo for the current policy course.


Thinking like a Cyclical Investor: Thus far, the domestic labor market data has indeed been an insular island of strength amidst a receding sea of global growth and inflation expectations. Capacity for consumption growth has improved alongside accelerating income although the ongoing rise in the savings rate has muted the translation to actual household spending growth.
With XLY (consumer discretionary) up just 1.69% YTD (vs. +22%/21% for XLV/U) and taking the penultimate position in Sector SPDR performance, that improving, under-the-hood fundamental reality hasn’t gotten anyone paid or served as a catalyst of consequence.
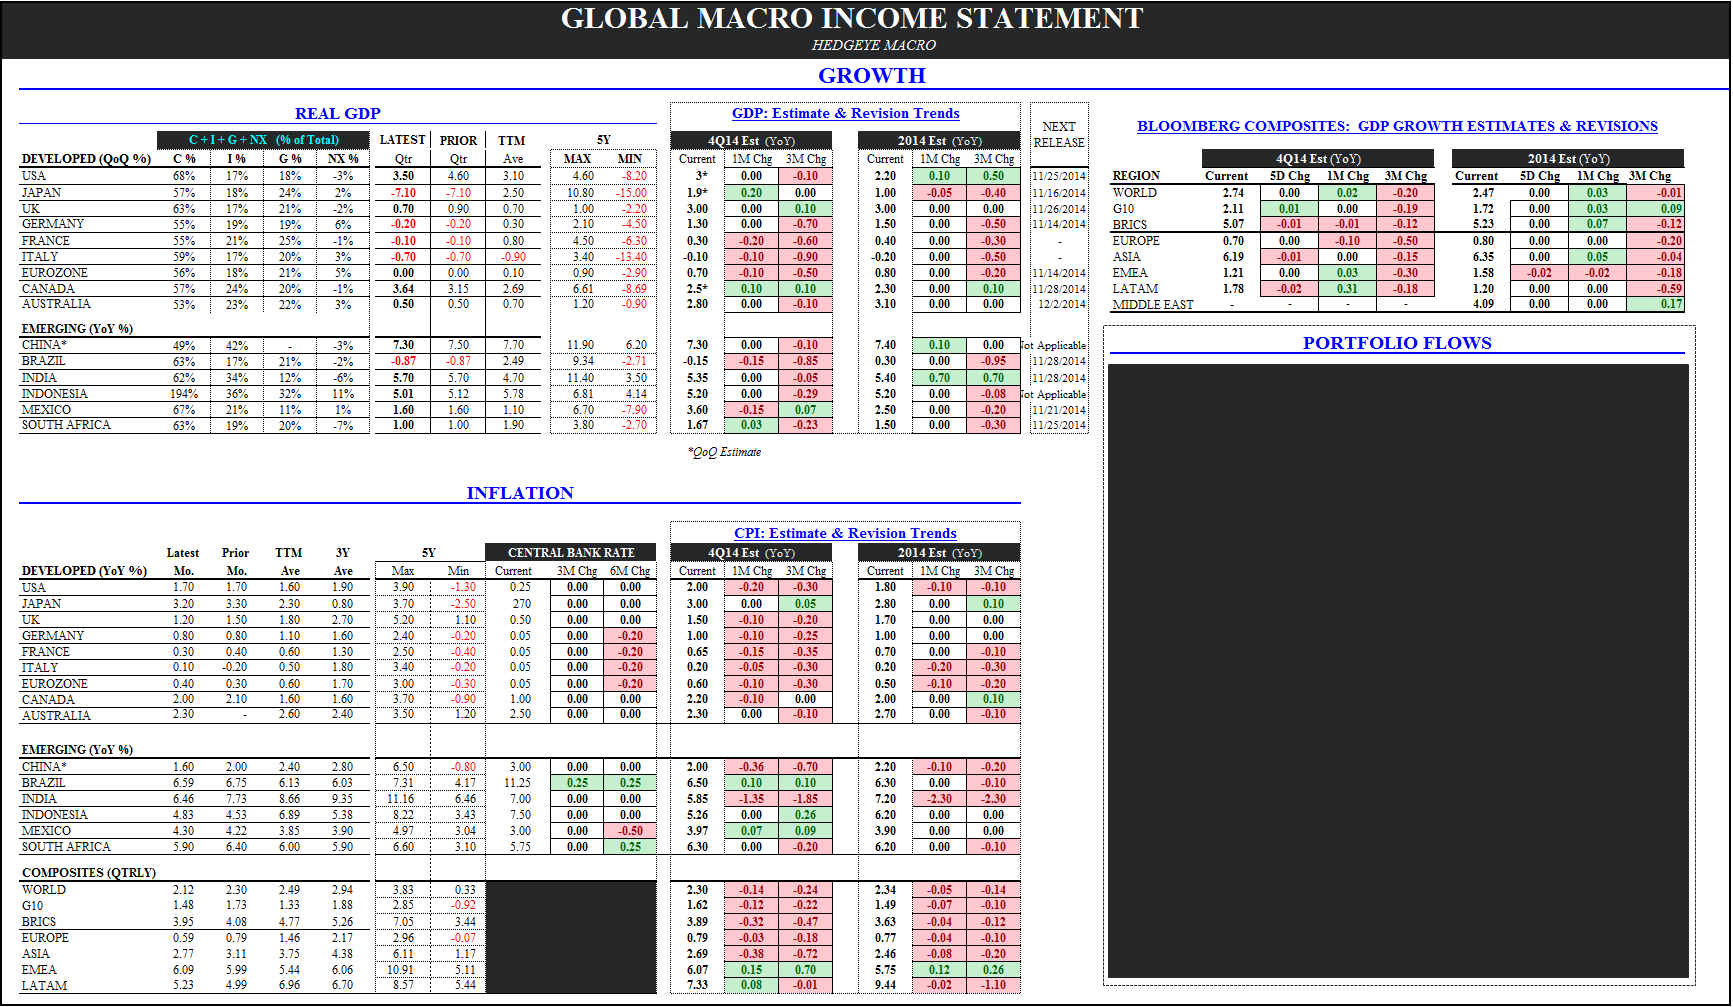
We are now 65 months into the current expansion (against a mean duration of expansion of 59 and 62 months over the last century and post-WWII period, respectively), domestic inflationary policy is ebbing and disinflation & growth deceleration are predominating globally. The preponderance of red in table below = negative growth/inflation revision trends.
With bonds outperforming almost everything YTD and defensive equity style factors crushing small cap and early cycle exposure, the market is discounting a global transition into Quad #4 ….not a sustained, labor market led domestic decoupling.
…..although the Siren Song of the late-cycle data is certainly seductive for the pro-cyclical investor/economist.
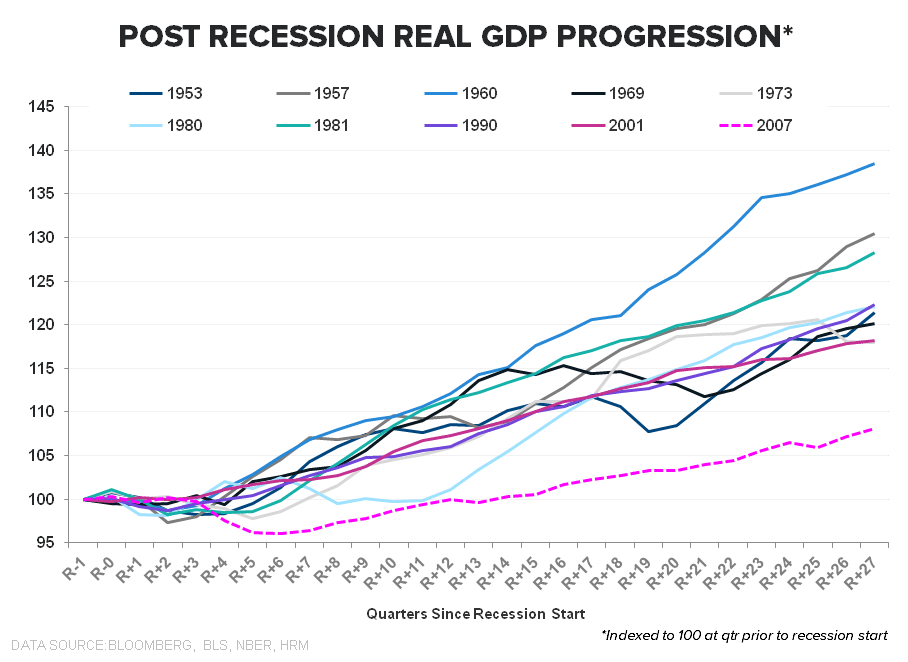
Macro Realists…with a View: From a fundamental perspective, we’re not saying an economic crash is necessarily imminent. In fact, historical cycle precedents suggest the peak in the economic cycle consistently occurs ~7 months after the trough in Initial claims and peak gains in monthly payrolls. And as it stands currently, we’re still establishing levels of peak improvement in both those measures.
Timing the market peak, however, has been a more Daedalean effort. Over the post-war period, the temporal, labor peak --> market peak --> economic peak has been fairly consistent. However, over the last two cycles the market peak has occurred largely coincident to peak improvement in leading labor metrics.
Given where we are in the cycle, our expectation for domestic growth to slow from a rate of change perspective and the discrete slowdown OUS, we continue to like cash, the long-bond and XLP/U/V sector exposure (at a price).
Those recommendations aren’t particularly sexy or creative - we’ve been recommending that all year- but we think they continue to work over the immediate/intermediate term as prices/expectations re-couple to (a less sanguine) reality.


A few of the other Notables:
PAYROLLS: Net payroll gains slowed sequentially but the YoY and 2Y ave growth rates were essentially flat and holding at the peak level seen in the last cycle The Household Survey – which is largely useless on month-to-month basis - was strong with the labor force rising alongside a reported +638K gain in Employment and a decline of -267K in Unemployed

UNEMPLOYMENT: The unemployment rate ticked down to 5.8% and the U-6 rate declined to 11.5%, dropping the most in 7-months – both of which, if they follow their present trajectory, will be consistent with a tightening timeline in 3q/4q next year.

SLACK: Alongside the decline in the U-6 rate, the share of ST unemployed continues to rise, the trend in NFIB’s Jobs Hard to Fill and Compensation Indices remain positive, and available workers per job opening is back to pre-recession averages


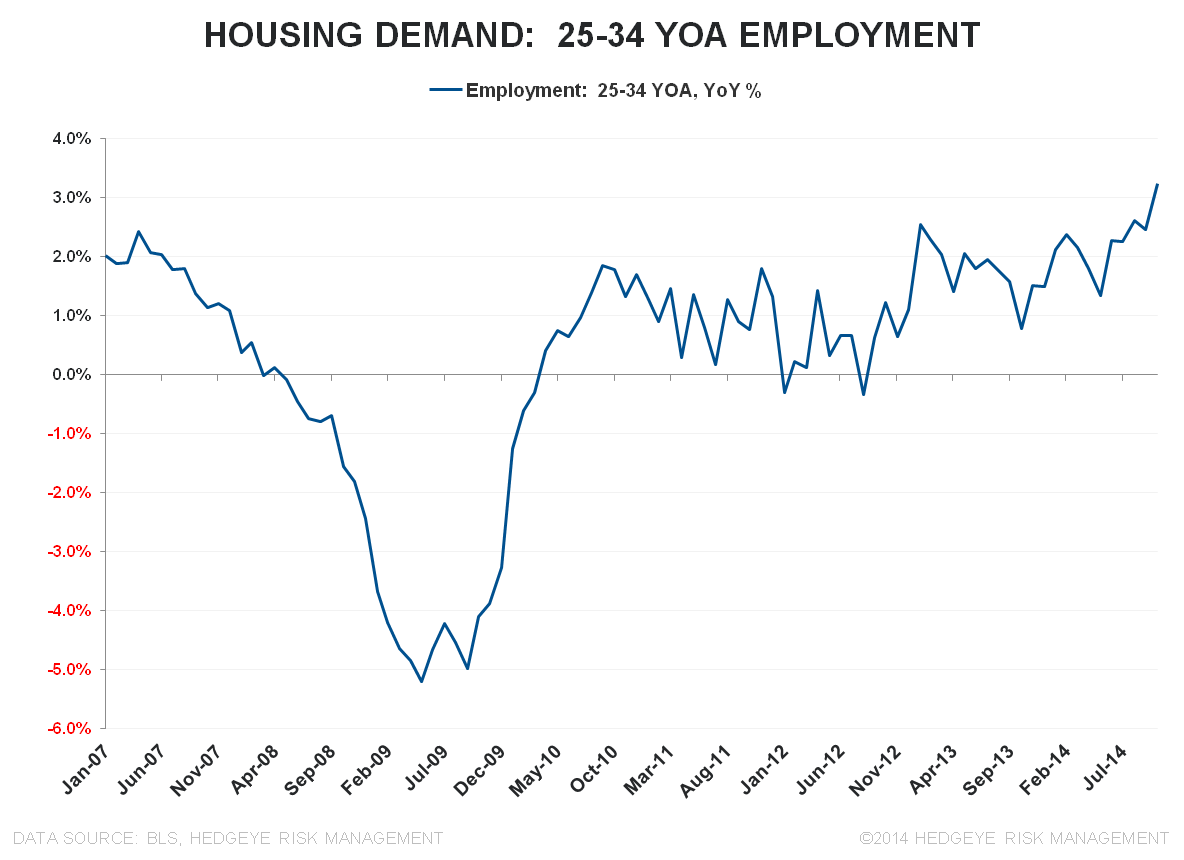
HOUSING DEMAND: The employment-to-population ratio for 25-34 year olds ticked up again as employment growth for the cohort accelerated +70bps to +3.2% YoY – the fastest rate of growth since well before the start of the Great Recession.
As we’ve highlighted, intuitively, housing demand from this demographic (which is central to 1st-time homebuyer demand) could be expected to improve over the intermediate term as employment growth matures, savings time accumulates, and work history reaches a duration necessary to satisfy mortgage underwriting standards in a tighter regulatory environment.

Enjoy the Weekend,
Christian B. Drake
@HedgeyeUSA
