

Investment Company Institute Mutual Fund Data and ETF Money Flow:
The most recent ICI mutual fund survey showed a reprieve from the drastic taxable bond fund outflows of the past 5 weeks set into motion with the portfolio manager change at PIMCO. Taxable bond redemptions slowed to just $295 million in the most recent 5 days, a far cry from the past 4 weeks where the sequence of redemptions was $21.0 billion, $4.6 billion, $5.1 billion, and $4.9 billion. The total money set into motion however tallies $36 billion, which is keeping a strong bid for BlackRock (BLK) and Legg Mason (LM) and the obvious beneficiary Janus Capital (JNS). Looking at the similar analog in 2010 of Jeff Gundlach leaving TCW, the TCW Total Return Fund shed 55% of its assets-under-management (AUM) over an 18 month period, which could put a fairly long tail on taxable bond fund money in motion in the upcoming year. The PIMCO Total Return Fund prior to the Bill Gross departure had $220 billion in AUM. Thus if the TCW/Gundlach analog were to exactly play out for PIMCO, this would put over $100 billion out into the bond sphere up for grabs with Janus having the chance to capture over $70 billion (or 70% of that redemption). We think the situation is slightly different this time with PIMCO Total Return having been managed "by committee" to begin with and the fund having put up bottom decile returns over the past 18 months. Thus with lagging performance, the recapture by Gross of his prior AUM may be problematic. In the case of TCW, we assumed that Gundlach captured 70% of the TCW outflow (with money having left to other managers as well), which puts the total net capture of his existing AUM at 39 cents on the dollar.

In other survey data, U.S. equity mutual funds had another slight inflow at $1.1 billion in the most recent week, although the intermediate term trend is still very soft with outflows in 24 of the past 27 weeks. Passive fund flows via ETFs were robust again with both total equity ETFs and total bond ETFs taking in substantial new assets. One call out in the sector ETFs is that the Materials Sector SPDR (XLB), lost a whopping $1.4 billion in AUM last week. That reduced total AUM by 31% in just 5 days alone.

In the most recent 5 day period ending October 29th, total equity mutual funds put up inflows with $2.3 billion coming into the category according to the Investment Company Institute. The composition of the inflow was balanced with Domestic stock funds taking in a $1.1 billion subscription which matched the $1.2 billion which came into International stock funds. The two equity categories have been a tale of two cities all year however with International stock funds having had inflow in 42 of the past 43 weeks. Conversely, domestic trends have been very soft with inflow in just 15 weeks of the 43 weeks thus far year-to-date and have been drastically negative the past 6 months with just 3 weeks of inflow in the past 27 weeks. The running year-to-date weekly average for all equity fund flow continues to decline and now settles at a $1.1 billion inflow, now well below the $3.0 billion weekly average inflow from 2013.
Fixed income mutual fund flow had another drawdown in the most recent ICI data succumbing to more net selling from the dislocation at large bond fund manager PIMCO. Total bond funds lost another $66 million last week with the distribution focused within the taxable bond fund category which lost another $295 million in the most recent 5 days. This brings the "money in motion" or the taxable outflow to over $36 billion in the past 5 weeks. Municipal or tax-free bond funds put up a $299 million inflow, making it 41 of 42 weeks with positive subscriptions. The 2014 weekly average for fixed income mutual funds now stands at a $881 million weekly inflow, an improvement from 2013's weekly average outflow of $1.5 billion, but still a far cry from the $5.8 billion weekly average inflow from 2012 (our view of the blow off top in bond fund inflow).
ETF results were very strong during the week with substantial inflows in equity funds and decent subscriptions into passive fixed income products continuing to mop up the ongoing redemption in taxable bond funds. Equity ETFs put up a $13.0 billion subscription while fixed income ETFs had a $1.3 billion inflow. The 2014 weekly averages are now a $1.8 billion weekly inflow for equity ETFs and a $1.1 billion weekly inflow for fixed income ETFs.
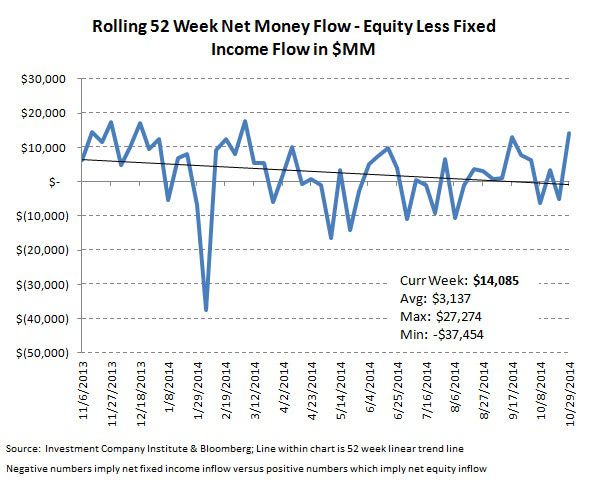
The net of total equity mutual fund and ETF trends against total bond mutual fund and ETF flows totaled a positive $14.0 billion spread for the week ($15.4 billion of total equity inflow versus the $1.3 billion inflow within fixed income; positive numbers imply greater money flow to stocks; negative numbers imply greater money flow to bonds). The 52 week moving average has been $3.1 billion (more positive money flow to equities), with a 52 week high of $27.2 billion (more positive money flow to equities) and a 52 week low of -$37.5 billion (negative numbers imply more positive money flow to bonds for the week). The 52 week moving average chart displays the declining demand for all equity products (funds and ETFs) for the safety and security of fixed income.
Mutual fund flow data is collected weekly from the Investment Company Institute (ICI) and represents a survey of 95% of the investment management industry's mutual fund assets. Mutual fund data largely reflects the actions of retail investors. Exchange traded fund (ETF) information is extracted from Bloomberg and is matched to the same weekly reporting schedule as the ICI mutual fund data. According to industry leader Blackrock (BLK), U.S. ETF participation is 60% institutional investors and 40% retail investors.
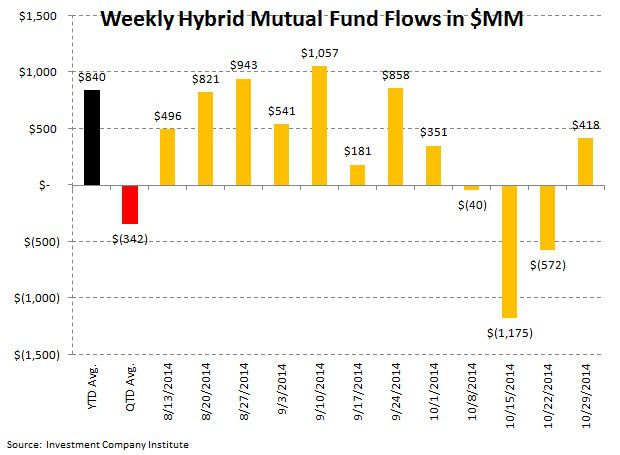
Most Recent 12 Week Flow in Millions by Mutual Fund Product: Chart data is the most recent 12 weeks from the ICI mutual fund survey and includes the running weekly year-to-date average for 2014 and the weekly quarter-to-date average for 4Q 2014:


Most Recent 12 Week Flow Within Equity and Fixed Income Exchange Traded Funds: Chart data is the most recent 12 weeks from Bloomberg's ETF database (matched to the Wednesday to Wednesday reporting format of the ICI) and the running weekly year-to-date average for 2014 and the weekly quarter-to-date average for 4Q 2014. The third table are the results of the weekly flows into and out of the major market and sector SPDRs:


Sector and Asset Class Weekly ETF and Year-to-Date Results: In specific callouts, the Basic Materials ETF (XLB) got hammered in the most recent 5 days losing 31% of its AUM or an outflow of $1.4 billion. In addition, it is interesting that the Energy Sector SPDR has still added 33% to its total AUM thus far in 2014 which could mean the blood letting in that group could continue with oil prices continuing a downward slope.

Net Results:
The net of total equity mutual fund and ETF trends against total bond mutual fund and ETF flows totaled a positive $14.0 billion spread for the week ($15.4 billion of total equity inflow versus the $1.3 billion inflow within fixed income; positive numbers imply greater money flow to stocks; negative numbers imply greater money flow to bonds). The 52 week moving average has been $3.1 billion (more positive money flow to equities), with a 52 week high of $27.2 billion (more positive money flow to equities) and a 52 week low of -$37.5 billion (negative numbers imply more positive money flow to bonds for the week). The 52 week moving average chart displays the declining demand for all equity products (funds and ETFs) for the safety and security of fixed income.
Exposures: The weekly data herein is important for the public asset managers with trends in mutual funds and ETFs impacting the companies with the following estimated revenue impact:

Jonathan Casteleyn, CFA, CMT
Joshua Steiner, CFA
