
Our Hedgeye Housing Compendium table (below) aspires to present the state of the housing market in a visually-friendly format that takes about 30 seconds to consume.
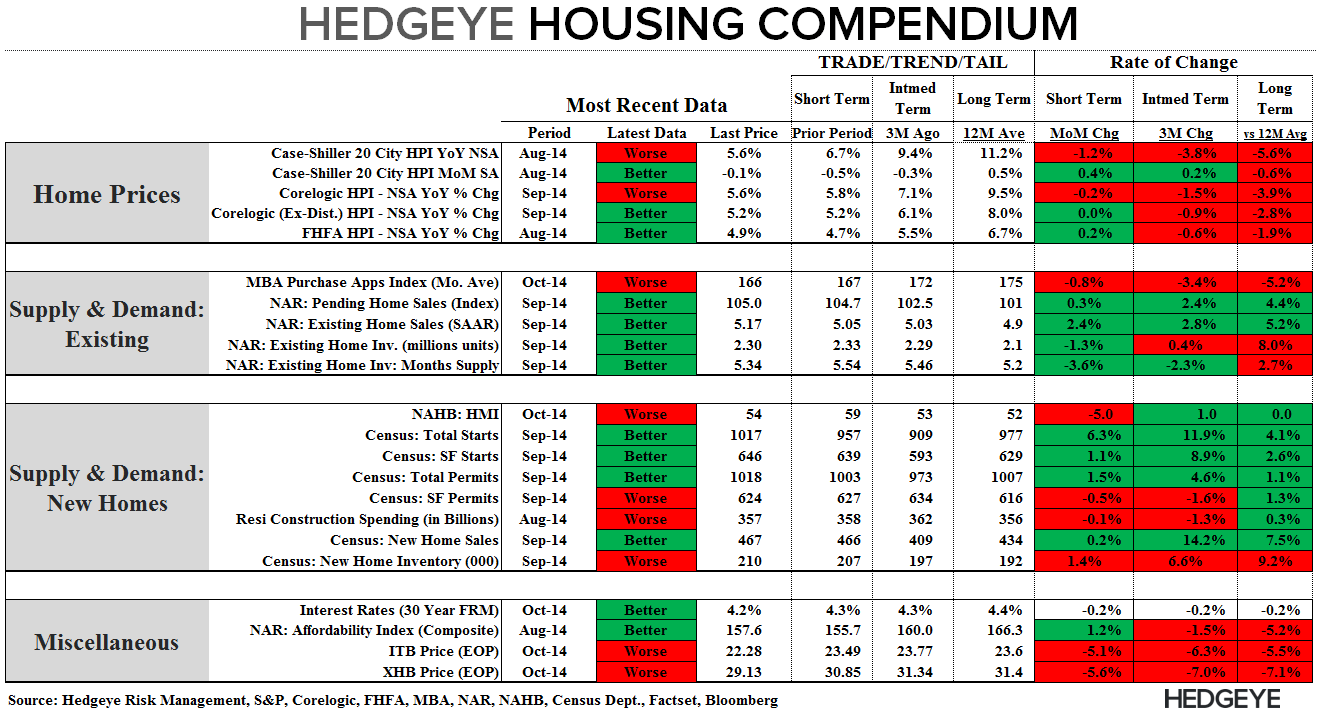
Today's Focus: September CoreLogic Home Price Report
CoreLogic released its monthly home price report for September earlier this morning. Unlike S&P/Case-Shiller, which is a rolling 3-month average repeat sales index, CoreLogic is a single month index released on a one-month lag. Essentially, it gives you information 2-3 months more current than what you get from Case-Shiller.
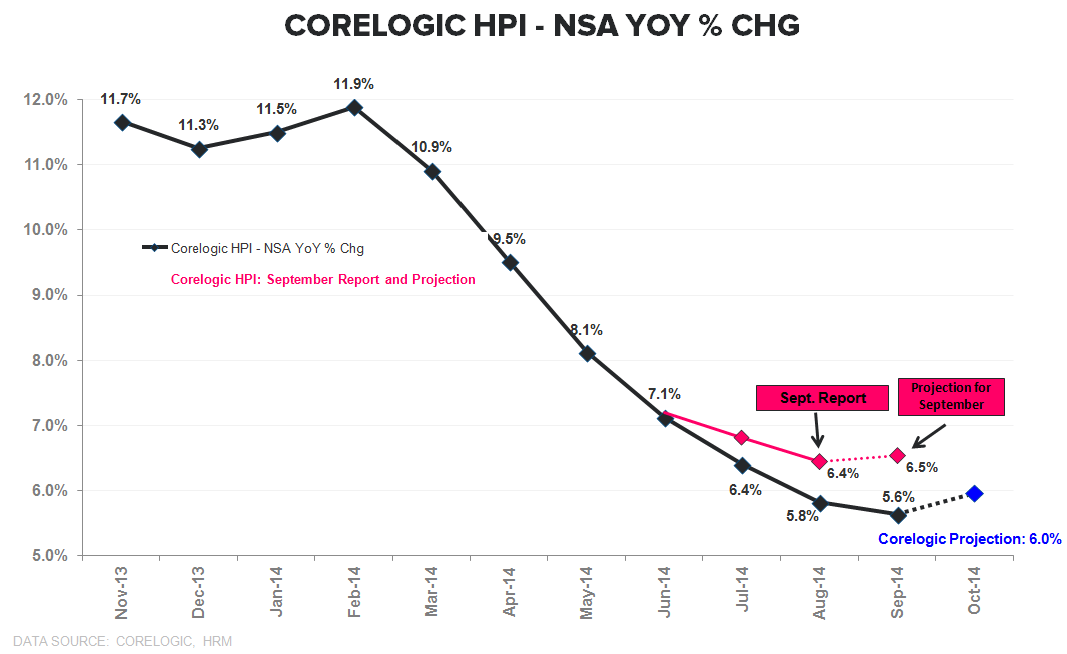
Corelogic reported home price growth slowed -20bps sequentially to +5.6% YoY in September vs. +5.8% in August. There are a few notables in the release worth highlighting:
- Volatility: The now serial volatility in the data extended into September as July was revised to 6.4% (from 6.8%), August was revised to 5.8% (from 6.4%) and the September actual of +5.6% YoY came in almost a full percentage point below the econometric projection issued last month.
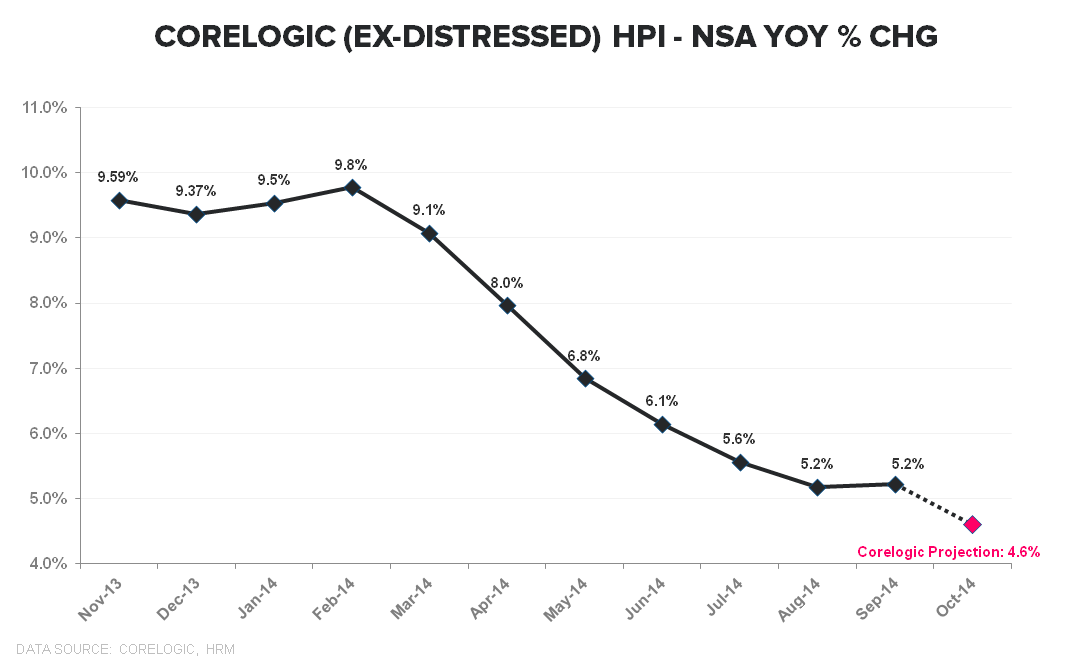
- Projection: The projection for the national series is for a 0.1% MoM increase in October which equates to a sequential acceleration in prices +6.0% YoY. They have been making a false prediction of acceleration in their projection for a few months now. In contrast, the Ex-Distressed series is projected to decline -0.8% MoM (largest sequential slowdown since 2011) with the YoY decelerating -60bps to +4.6%
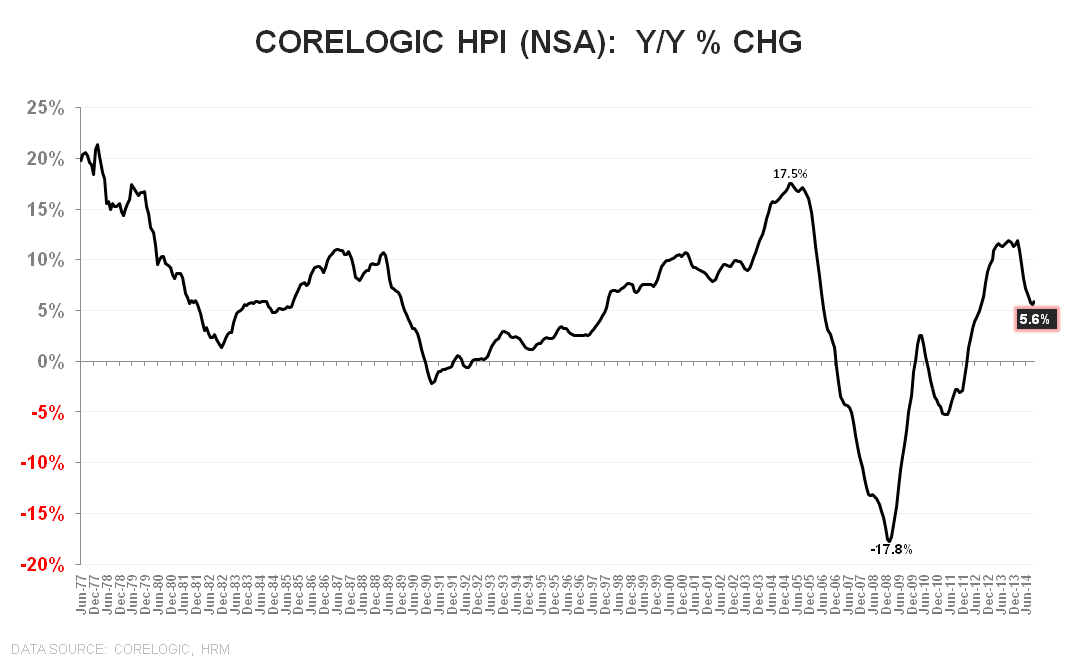
- ROC: September marks the 7th consecutive month of deceleration in HPI from a rate of change perspective. However, the rate of change in the second derivative (ie. the 3rd derivative) in HPI is slowing – whereas the monthly decelerations were on the order of -100bps from February to June, they have slowed to just -60bps and -20bps in the last two months, respectively.
- Slope Surfing: While a slowing macro environment remains a discrete risk to the housing market, a fledgling stabilization in HPI alongside easy demand comps and significant YTD underperformance for housing related equities has us significantly less bearish currently than we were 10 months ago when we turned negative on the complex.
About CoreLogic:
CoreLogic HPI incorporates more than 30 years worth of repeat sales transactions, representing more than 55 million observations sourced from CoreLogic's property information database. The CoreLogic HPI provides a multi-tier market evaluation based on price, time between sales, property type, loan type (conforming vs. nonconforming), and distressed sales. The CoreLogic HPI is a repeat-sales index that tracks increases and decreases in sales prices for the same homes over time, which provides a more accurate constant-quality view of pricing trends than basing analysis on all home sales. The CoreLogic HPI covers 6,208 ZIP codes (58 percent of total U.S. population), 572 Core Based Statistical Areas (85 percent of total U.S. population) and 1,027 counties (82 percent of total U.S. population) located in all 50 states and the District of Columbia."
Joshua Steiner, CFA
Christian B. Drake
