This note was originally published at 8am on October 20, 2014 for Hedgeye subscribers.
“We will have to send soldiers into this party seeing red.”
-Bernard Montgomery
World War II #history rarely accuses British Army General Bernard Montgomery of having a confidence problem. He was often decisive and ruthless. In the end, he was also a winner.
On the eve of landing on the beaches of Normandy, Monty’s bravado reminded Churchill’s Chief of Staff (Lieutenant Hastings Ismay) of the eve of Agincourt (as depicted in Henry V):
“He which hath no stomach to this fight – let him depart.” (The Guns At Last Light, pg 11)

Back to the Global Macro Grind…
Seeing red, in single-factor price momentum terms, is not what everyone saw on Friday’s US stock market bounce. That’s because not everyone looks at risk on a multi-factor, multi-duration basis. But that doesn’t mean it ceases to exist.
Actually, the Russell 2000 was down on Friday, so even in single-factor terms, many saw red. Don’t forget that even though the Russell was up for the 1st week in 7, over 60% of stocks in the Russell 2000 are currently crashing (-20% from their 12-month highs).
Back to the multi-factor thing, we highly suggest you consider Mr. Macro’s market message on a baseline 3-factor basis – PRICE, VOLUME, and VOLATILITY. In those terms, this is what we saw on Friday’s “bounce”:
- PRICE – both the SPX and Russell failed at all 3 core levels of @Hedgeye resistance (TRADE, TREND, TAIL)
- VOLUME – Total US Equity Market Volume was -11% and -4% vs. its 1 and 3 month averages, respectively
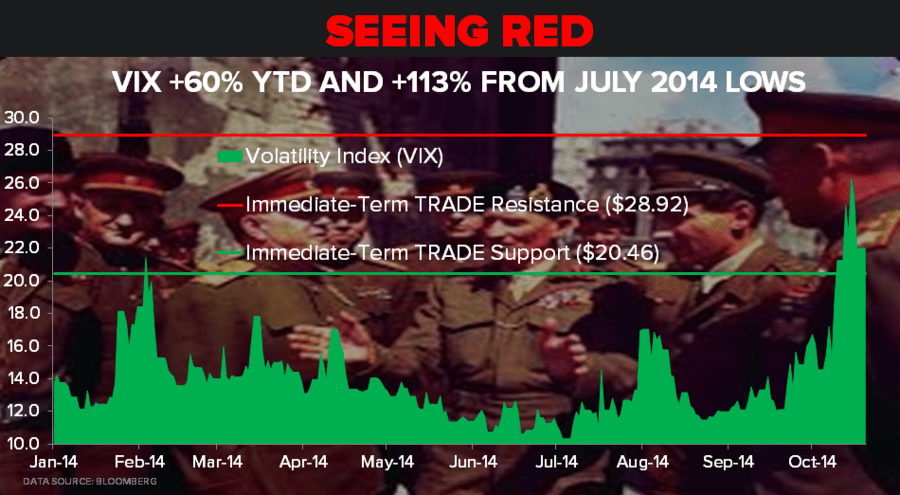
- VOLATILITY – VIX was down on the day but +3.5% and +60.3% for the week and YTD, respectively
Price momentum is an easy concept for people to understand (it goes up or down – look at the chart, bro!). That’s why many still use what I affectionately refer to as Moving Monkeys (50 and 200 day) in order to contextualize price. Unfortunately, that is not a risk management process.
The direction of price obviously matters, but so does multi-factor context. Here’s what I mean by that:
- BULLISH – Price Up, Volume Up, Volatility Down
- BEARISH – Price Down, Volume Up, Volatility Up
Within the context of a bearish intermediate-term TREND @Hedgeye, Price UP, Volume DOWN, and trending (implied) Volatility UP is bearish too.
Setting aside our research view of US #GrowthSlowing, to get bullish and “buy-the-damn-dip” in US Equity beta, what I would need to see is the SP500 close above my immediate-term TRADE line of 1949 on accelerating VOLUME and a break-down in the VIX below my TRADE line of 15.03.
Those of you paying attention to my immediate-term risk ranges will note that these levels aren’t in the area code of today’s ranges. And, to a degree, that’s the point. If I look beyond 1-3 days in duration (to 3 weeks), I’m seeing a heightening probability of more red.
Across asset classes (multi-factor), here are the other big #Quad4 deflationary forces at work across multiple-durations (TRADE and TREND):
- European Equity deflation of -0.9% last week (-2.9% YTD EuroStoxx600) is bearish TRADE and TREND
- Emerging Market Equity deflation of -1.9% last week (-3.2% YTD MSCI) is bearish TRADE and TREND
- CRB Index deflation of -1.1% last week (-2.7% YTD) is bearish TRADE and TREND
- Oil (WTI) deflation of -3.3% last week (-11.1% YTD) is bearish TRADE and TREND
- Energy Equity (XLE) deflation of -1.1% last week (-6.6% YTD) is bearish TRADE and TREND
Then, of course, you have trivial risk signals like:
- US 10yr Treasury Yield crashing (-27% YTD) to 2.19% (bearish TRADE, TREND, and TAIL)
- US Treasury Yield Spread crashing (-31% YTD) to +182bps wide (10yr minus 2yr)
- And Credit Spreads starting to move off of their all-time lows as equity and commodity volatilities breakout
“So”, yes, I do see more red pending in US, European, and Emerging Market Equities in the coming weeks and months. And, no, I don’t think last week’s immediate-term capitulation was the bottom.
But consensus does! Here’s the updated net positioning of hedge funds in non-commercial CFTC futures/options terms:
- SP500 (Index + E-mini) got longer by +5,537 contracts to a net LONG position of +54,153 last week
- 10yr Treasury Bond saw shorts get -6,976 contracts shorter last week to a net SHORT position of -58,930
- Crude Oil bulls only gave up -14,225 contracts last week, keeping the net LONG position at +285,500 contracts!
In other words, consensus got longer of the US stock market, shorter of the Long Bond, and not nearly less-long enough of a crashing Oil price.
I know that some are frustrated out there with their performance. I can assure you that I’ve been there and had to deal with that. But there comes a time where you have to choose between being consensus and not seeing any more red in your P&L.
Our Immediate-term Global Macro Risk Ranges are now:
UST 10yr Yield 2.09-2.28%
SPX 1830-1900
RUT 1040-1101
VIX 20.46-28.92
WTI Oil 79.96-84.58
Gold 1211-1251
Best of luck out there this week,
KM