Investment Company Institute Mutual Fund Data and ETF Money Flow:
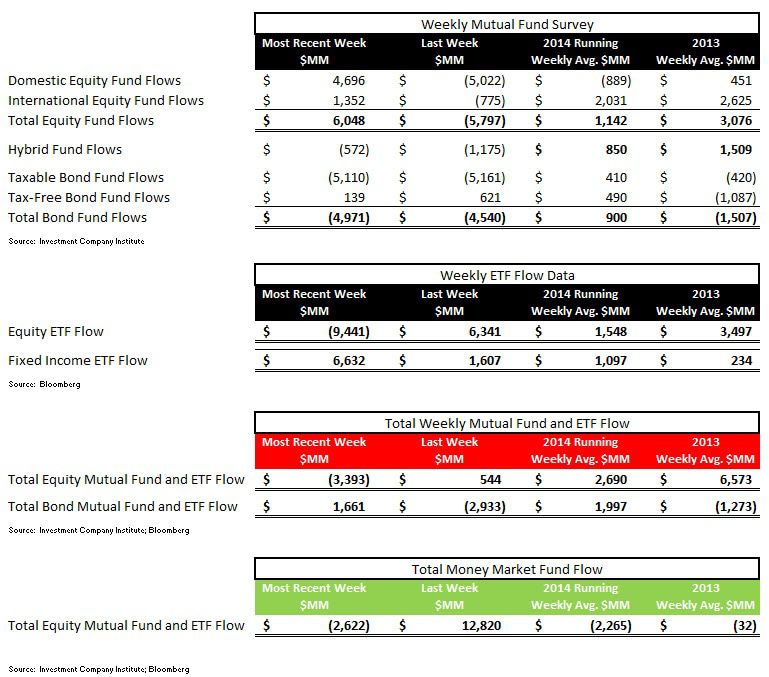
The most recent ICI mutual fund survey showed a reprieve from the drastic domestic equity fund outflows of the past 5 months with a solid $4.6 billion inflow coming into U.S. stock funds last week. Despite this one week uptick, domestic stock funds have had outflow in 24 of the past 26 weeks with over $57 billion lost which continues to be supportive of our underweight recommendations on the U.S. equity asset managers. In other important trends, the bleeding in taxable bond funds continued with another $5.1 billion redemption being yanked from the category. This dislocation in taxable fixed income has largely come about with the transfer of Bill Gross from PIMCO to Janus Capital and in aggregate has put over $35 billion in motion over past 4 weeks. Fixed Income ETFs have been a direct beneficiary with over $17 billion picked up in those products during the same time. In addition, BlackRock has been mentioned in several media outlets as also having picked up new assets-under-management (AUM). There still has been di minimus mention of any new Janus gains with the Gross addition however the October Simfund report will be out next week which will highlight AUM wins at the manager level. We are still skeptical that the magnitude of any Janus wins will match the market cap rise in shares of the company (see our ongoing view on Janus in the research link enclosed). In ETF trends detailed below, we highlight that the Basic Materials ETF (XLB) took in $328 million of new money last week or a 9% gain in total AUM. Conversely, investor interest waned in the XLU or the Utilities Sector SPDR, with a 5% net redemption in that ETF. In addition, despite all the noise around the energy patch over the past several months, the XLE or the Energy Sector SPDR has still added 34% to its total AUM in 2014 which could mean the blood letting in that group could continue.
Hedgeye Research - Mantaining Shorts on the Equity Asset Managers After Earnings
In the most recent 5 day period ending October 22nd, total equity mutual funds put up solid inflows with $6.0 billion coming into the category according to the Investment Company Institute. The composition of the inflow for the first time in over 7 months was weighted towards Domestic stock funds which had a $4.6 billion inflow supporting the $1.3 billion which came into International stock funds. The two equity categories have been a tale of two cities all year with International stock funds having had inflow in 41 of the past 42 weeks. Conversely, domestic trends have been very soft with inflow in just 14 weeks of the 42 weeks thus far year-to-date and have been drastically negative the past 6 months with just 2 weeks of inflow in the past 26 weeks. While one week does yet make a trend, it will be worth watching if the current equity rally spurs domestic investors to change their recent risk aversion. The running year-to-date weekly average for all equity fund flow continues to decline however and now settles at a $1.1 billion inflow, now well below the $3.0 billion weekly average inflow from 2013.
Fixed income mutual fund flow had another drawdown in the most recent ICI data succumbing to more net selling from the dislocation at large bond fund manager PIMCO. Total bond funds lost another $4.9 billion last week with the distribution focused within the taxable bond fund category which lost another $5.1 billion in the most recent 5 days. This brings the "money in motion" or the taxable outflow to over $35 billion in the past 4 weeks. Municipal or tax-free bond funds put up a $139 million inflow, making it 40 of 41 weeks with positive subscriptions. The 2014 weekly average for fixed income mutual funds now stands at a $900 million weekly inflow, an improvement from 2013's weekly average outflow of $1.5 billion, but still a far cry from the $5.8 billion weekly average inflow from 2012 (our view of the blow off top in bond fund inflow).
ETF results were very mixed during the week with substantial outflows in equity funds but subscriptions in passive fixed income products mopping up the ongoing redemption in taxable bond funds. Equity ETFs suffered a $9.4 billion redemption while fixed income ETFs put up a $6.6 billion subscription, the biggest inflow in 9 months (undoubtedly taking in some of that taxable fixed income fund money in motion). The 2014 weekly averages are now a $1.5 billion weekly inflow for equity ETFs and a $1.0 billion weekly inflow for fixed income ETFs.
The net of total equity mutual fund and ETF trends against total bond mutual fund and ETF flows totaled a negative $5.0 billion spread for the week (-$3.3 billion of total equity outflow versus the $1.6 billion inflow within fixed income; positive numbers imply greater money flow to stocks; negative numbers imply greater money flow to bonds). The 52 week moving average has been $3.3 billion (more positive money flow to equities), with a 52 week high of $27.2 billion (more positive money flow to equities) and a 52 week low of -$37.5 billion (negative numbers imply more positive money flow to bonds for the week). The 52 week moving average chart displays the declining demand for all equity products (funds and ETFs) for the safety and security of fixed income.
Mutual fund flow data is collected weekly from the Investment Company Institute (ICI) and represents a survey of 95% of the investment management industry's mutual fund assets. Mutual fund data largely reflects the actions of retail investors. Exchange traded fund (ETF) information is extracted from Bloomberg and is matched to the same weekly reporting schedule as the ICI mutual fund data. According to industry leader Blackrock (BLK), U.S. ETF participation is 60% institutional investors and 40% retail investors.
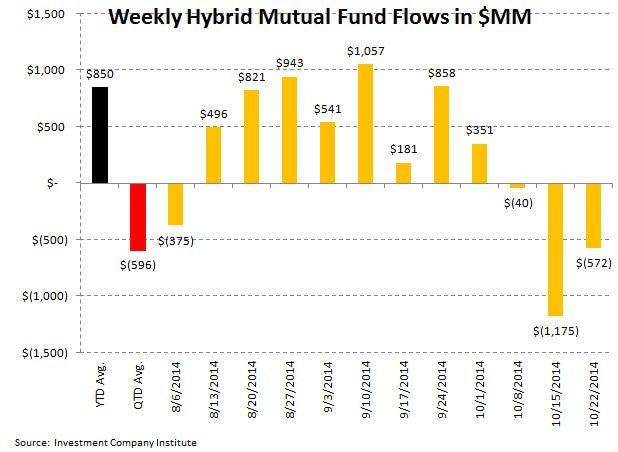
Most Recent 12 Week Flow in Millions by Mutual Fund Product: Chart data is the most recent 12 weeks from the ICI mutual fund survey and includes the running weekly year-to-date average for 2014 and the weekly quarter-to-date average for 4Q 2014:


Most Recent 12 Week Flow Within Equity and Fixed Income Exchange Traded Funds: Chart data is the most recent 12 weeks from Bloomberg's ETF database (matched to the Wednesday to Wednesday reporting format of the ICI) and the running weekly year-to-date average for 2014 and the weekly quarter-to-date average for 4Q 2014. The third table are the results of the weekly flows into and out of the major market and sector SPDRs:


Sector and Asset Class Weekly ETF and Year-to-Date Results: In specific callouts, the Basic Materials ETF (XLB) took in $328 million of new money last week or a 9% gain in total AUM. Conversely, investor interest waned in the XLU or the Utilities Sector SPDR, with a 5% net redemption in that ETF. In addition, despite all the noise around the energy patch over the past several months, the XLE or the Energy Sector SPDR has still added 34% to its total AUM thus far in 2014 which could mean the blood letting in that group could continue.

Net Results:
The net of total equity mutual fund and ETF trends against total bond mutual fund and ETF flows totaled a negative $5.0 billion spread for the week (-$3.3 billion of total equity outflow versus the $1.6 billion inflow within fixed income; positive numbers imply greater money flow to stocks; negative numbers imply greater money flow to bonds). The 52 week moving average has been $3.3 billion (more positive money flow to equities), with a 52 week high of $27.2 billion (more positive money flow to equities) and a 52 week low of -$37.5 billion (negative numbers imply more positive money flow to bonds for the week). The 52 week moving average chart displays the declining demand for all equity products (funds and ETFs) for the safety and security of fixed income.

Exposures: The weekly data herein is important for the public asset managers with trends in mutual funds and ETFs impacting the companies with the following estimated revenue impact:

Jonathan Casteleyn, CFA, CMT
Joshua Steiner, CFA