
Current Ideas:

Key Takeaway:
Our overriding message the last month has been one of caution. We overstayed our welcome on the short side by one week as the XLF had a nice (+3.5%) bounce last week, though that was following a 6.3% decline in the month leading up. The message from the summary table below is currently showing more green than red in the short-term and an even mix between red and green over the intermediate and longer-term durations. Based on this, we're taking the threat level down a notch this morning and characterizing the outlook as balanced based on our various risk monitor factors.
Financial Risk Monitor Summary
- Short-term(WoW): Positive / 5 of 12 improved / 1 out of 12 worsened / 6 of 12 unchanged
- Intermediate-term(WoW): Positive / 5 of 12 improved / 4 out of 12 worsened / 3 of 12 unchanged
- Long-term(WoW): Negative / 3 of 12 improved / 3 out of 12 worsened / 6 of 12 unchanged

1. U.S. Financial CDS - Swaps tightened for 24 out of 27 domestic financial institutions for an average decline of 6 bps. In fact, US financials are now tighter by 10 bps on the month. The biggest improvements came from BofA and MS (both were -6 bps w/w).
Tightened the most WoW: AXP, MTG, MBI
Widened the most WoW: TRV, MET, UNM
Tightened the most WoW: ACE, ALL, CB
Widened the most MoM: TRV, MET, SLM

2. European Financial CDS - 31 of 37 reference entities in Europe tightened on the week by an average of 5 bps. While the month-over-month change is still +11 bps, on average, it has moderated notably with this last print.

3. Asian Financial CDS - Indian bank swaps tightened by an average of 10 bps on the week and are now tighter by 17 bps on the month. Japanese financials were little changed on the week.

4. Sovereign CDS – Sovereign swaps were mixed last week with Italian swaps widening the most (+13 bps to 133 bps) and Portuguese swaps tightening the most (-6 bps to 190 bps).


5. High Yield (YTM) Monitor – High Yield rates fell 19.7 bps last week, ending the week at 5.83% versus 6.02% the prior week.

6. Leveraged Loan Index Monitor – The Leveraged Loan Index rose 12.0 points last week, ending at 1866.

7. TED Spread Monitor – The TED spread rose 1.8 basis points last week, ending the week at 22.6 bps this week versus last week’s print of 20.8 bps.

8. CRB Commodity Price Index – The CRB index fell -0.4%, ending the week at 270 versus 271 the prior week. As compared with the prior month, commodity prices have decreased -3.2% We generally regard changes in commodity prices on the margin as having meaningful consumption implications.

9. Euribor-OIS Spread – The Euribor-OIS spread (the difference between the euro interbank lending rate and overnight indexed swaps) measures bank counterparty risk in the Eurozone. The OIS is analogous to the effective Fed Funds rate in the United States. Banks lending at the OIS do not swap principal, so counterparty risk in the OIS is minimal. By contrast, the Euribor rate is the rate offered for unsecured interbank lending. Thus, the spread between the two isolates counterparty risk. The Euribor-OIS spread tightened by 2 bps to 7 bps.

10. Chinese Interbank Rate (Shifon Index) – The Shifon Index fell 4 basis points last week, ending the week at 2.42% versus last week’s print of 2.46%. The Shifon Index measures banks’ overnight lending rates to one another, a gauge of systemic stress in the Chinese banking system.

11. Chinese Steel – Steel prices in China rose 0.3% last week, or 10 yuan/ton, to 3,028 yuan/ton. We use Chinese steel rebar prices to gauge Chinese construction activity, and, by extension, the health of the Chinese economy.

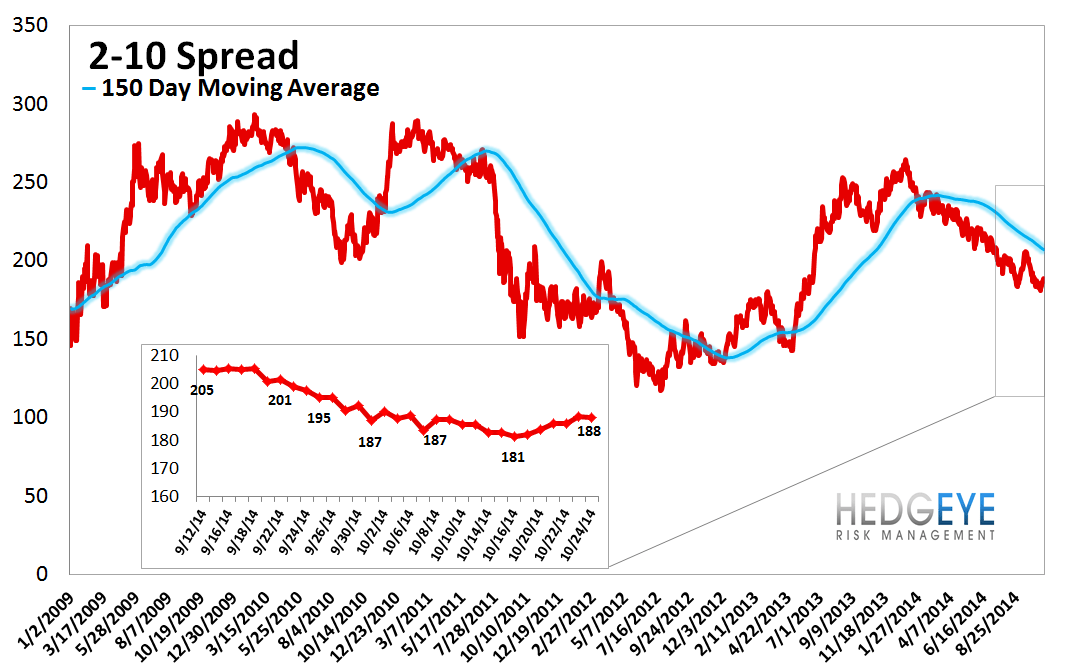
12. 2-10 Spread – Last week the 2-10 spread widened to 188 bps, 6 bps wider than a week ago. We track the 2-10 spread as an indicator of bank margin pressure.
13. XLF Macro Quantitative Setup – Our Macro team’s quantitative setup in the XLF shows 0.6% upside to TRADE resistance and 1.2% downside to TREND support.

Joshua Steiner, CFA
Jonathan Casteleyn, CFA, CMT
