Our Hedgeye Housing Compendium table (below) aspires to present the state of the housing market in a visually-friendly format that takes about 30 seconds to consume.

A Brief Comment on the FHFA Annoucement Yesterday:
ITB, the home construction ETF, has rallied ~6% over the last two trading days (Friday and Monday) in response to news that FHFA is going to expand mortgage credit availability. On Friday, stories ran in both the Wall Street Journal and Bloomberg previewing a coming announcement from FHFA Director, Mel Watt, about boosting mortgage credit availability. Yesterday, we got the announcement. Director Watt spoke at the MBA conference and laid out two changes that would be implemented. First, Fannie Mae and Freddie Mac would lower the down payment needed to 3% from 5%, effectively raising the minimum LTV (with mortgage insurance) from 95% to 97%. Second, Fannie and Freddie would rein in some of the mortgage putback provisions that have scared lenders into excessive underwriting conservatism from an originations perspective.
Regarding the first point, raising allowable LTVs two points, to 97% from 95%, will have little impact on the market. This is because the FHA already enables buyers to purchase homes with just 3.5% down payments. Much of the market that this would intend to address is already squarely served by the FHA. The GSEs are not relaxing FICO or DTI requirements, just lowering down payment standards to a level already available in the market through FHA.
On the second point, mortgage putback issues have been a major problem for banks for several years now. Post the housing crisis, banks have been extremely cautious in who they extend credit to largely out of fear that the loan will be put back to them for even a minor defect. Both JPMorgan and Wells Fargo, the two largest originators in the country, have spoken publicly about these issues many times. To that end, we think some further clarity around putbacks will help, on the margin, but is unlikely to cause banks to significantly expand the underwriting box. Remember that banks still have to comply with QM, which is where much of the pressure comes from.
Taken together, these two initiatives are positives, but we would argue small positives. We don't think this changes the landscape of mortgage finance in a material way over the intermediate term. We would also flag the timing of the announcement as interesting with midterm elections now less than 3 weeks away. Nothing sways voters like a last minute hat-tip to inflate the value of their primary asset.
Today's Focus: September Existing Home Sales
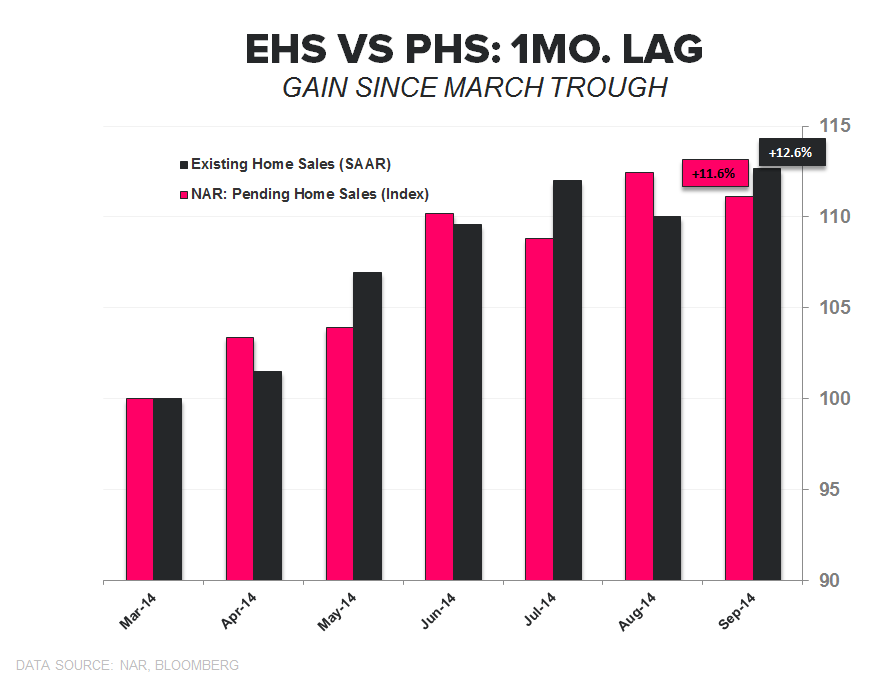
As we've highlighted, there's limited usefulness in the EHS report on the sales side since the data is well-telegraphed by the Pending Home Sales report a month earlier. We show this in the 1st chart below, where we've offset the EHS data by one month to show its correlation to PHS on a 1-month lag.
Despite the limited real-time utility in terms of demand trends, there is value in the data on inventory and the composition of sales (first-time buyers, cash buyers, investor share). This month we flag the still-anemic level of first time homebuyers (29% vs 2001-2008 average of ~40%).

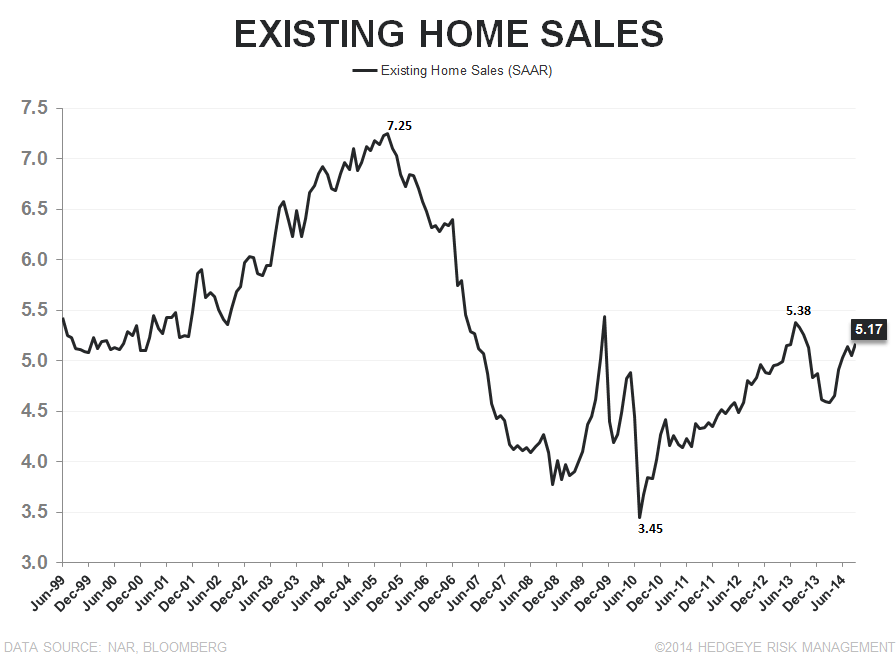
TOTAL EXISTING HOME SALES: Total EHS resumed its uptrend in September after stumbling in August. Sales rose 2.4% MoM to 5.17mn SAAR. Meanwhile, the year-over-year rate of change slowed to a decline of 1.7%, an improvement vs the 5.3% decline in August. From a growth perspective, the YoY comps get progressively easier through the balance of the year as we lap the rising rate environment of 2H13.
For comparison, Pending home sales have advanced +11.6% since the trough in March vs +12.6% for EHS and, given the recent pattern highlighted above, its likely we see a modestly worse sequential EHS print in October.
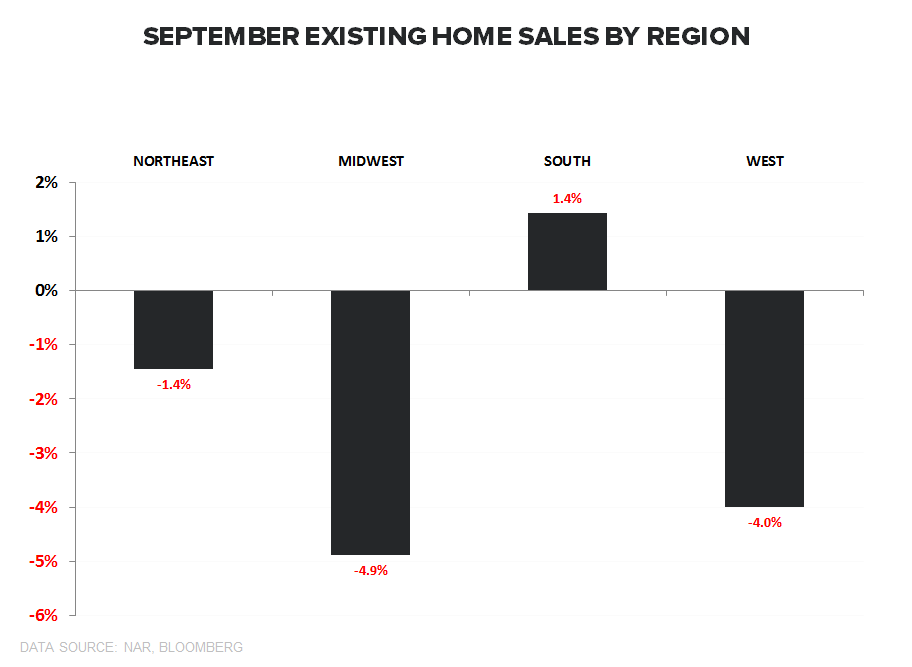
REGIONAL: The South and West regions registered strong sequential gains in sales while the Northeast saw a modest gain and the Midwest declined a full 5.6% MoM. Sales across all regions but the South remain negative on a YoY basis. The South is now up +1.4% vs the same period last year.
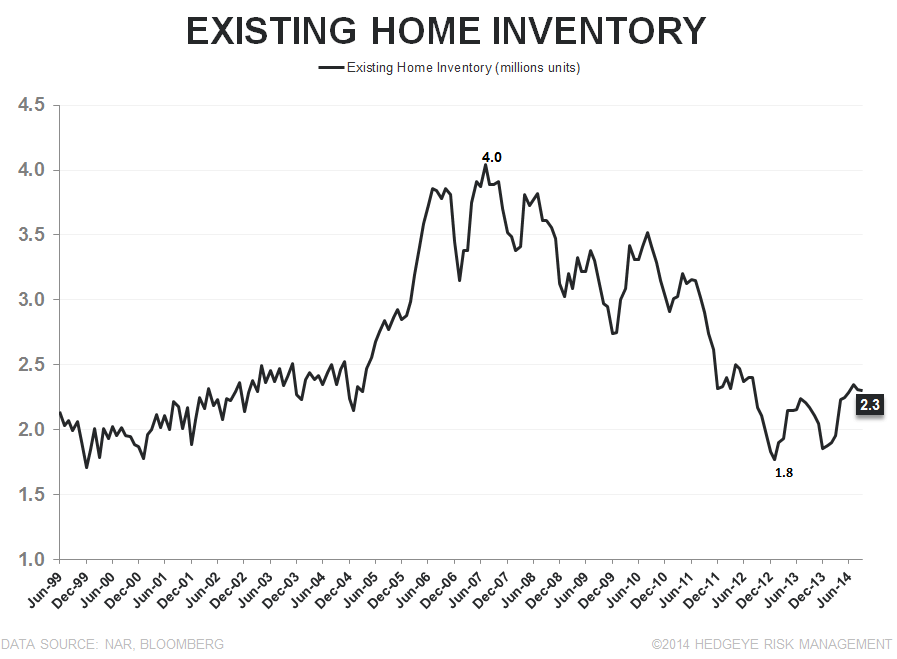
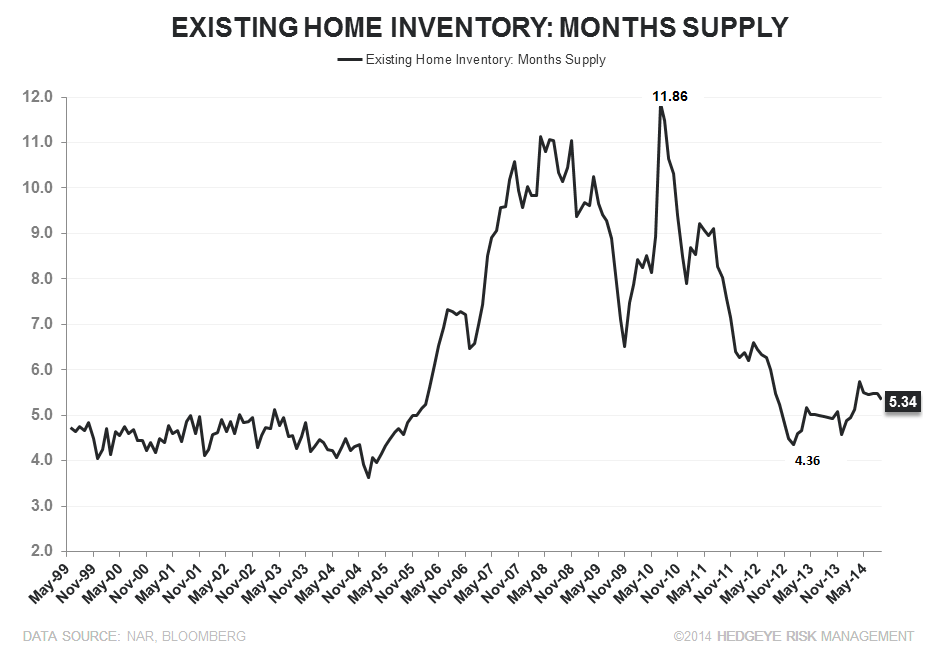
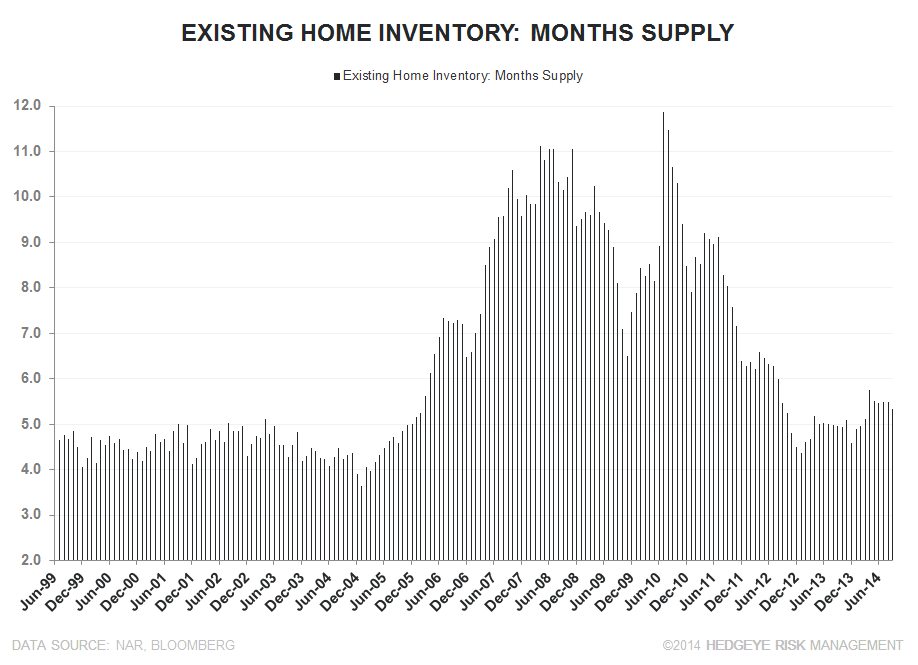
INVENTORY: On a unit basis, existing home inventory declined -0.4% MoM, marking the 2nd month of sequential decline in supply since December of last year. On a months supply basis, inventory was slightly lower sequentially at 5.34 months in September and up +7.8% YoY
OTHER: The share of first time homebuyers remains anemic, coming in at 29% in September. First time homebuyers have been sub-30% now for 17 of the last 18 months. The share of first time homebuyers was generally above 40% from 2001-2008 and briefly hit 50% in 2010 in response to the government's homebuyer tax credit programs. Meanwhile, cash sales remain at 24% of transactions in September, down from 33% in September last year.

About Existing Home Sales:
The National Association of Realtors’ Existing Home Sales index measures the number of closed resales of homes, townhomes, condominiums, and co-ops. Existing home sales do not take into account the sale of newly constructed homes. Existing home sales account for 85-95% of all home sales (new home sales account for the remainder). Therefore, increases in existing home sales tend to signify increasing consumer confidence in the market. Additionally, Existing Home Sales is a lagging series, as it measures the closing of homes that were pending home sales between 1 and 2 months earlier.
Frequency:
The NAR’s Existing Home Sales index is published between the 20th and the 22nd of each month. The index covers data from the prior month.
Joshua Steiner, CFA
Christian B. Drake
