Investment Company Institute Mutual Fund Data and ETF Money Flow:
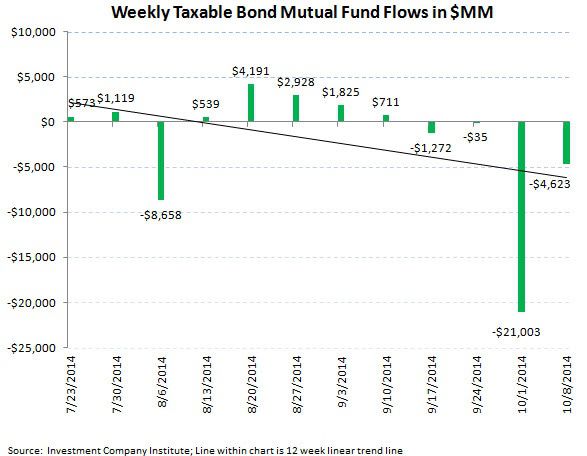
The most recent weekly ICI fund flow survey relayed the ongoing distribution within the taxable bond fund category as a result of the reshuffling of the cards among the major bond fund managers with the Bill Gross departure from PIMCO. Taxable bonds lost another $4.6 billion last week according to the ICI which brings the money in motion from the Gross transfer to over $25 billion over the past two weeks. According to several sources, Gross' new home Janus Capital (JNS), has collected just $60 million of these funds up for grabs which still doesn't foote with the stock's recent strong move up in market value. We are still looking to Janus' conference call next Thursday October 23rd to understand the compensation award to Gross versus his new assets-under-management win potential. While JNS stock has corrected over 12% since September 26th, we still see more downside should the company have awarded a large comp structure to Gross without requisite inbound assets to offset new operating costs. In addition, the earnings print from asset management juggernaut BlackRock (BLK) yesterday displayed weakness in both retail equity mutual fund flows as well as institutional equity fund flows which we think is a negative read through for T Rowe Price (TROW). While there are some ideosyncrasies between the two franchises (mainly that institutionally, BLK is in the midst of a fundamental equity restructuring), we point out however that over the past 6 quarters that both T Rowe and BlackRock fund flow trends have not decoupled from each other. In addition, we highlight that both active mutual fund only managers Janus and T Rowe continue to swim upstream against ongoing market share gains by passive ETFs trends which continue to be fairly robust on a year-to-date basis versus active management mutual fund trends. Thus we continue to be cautious on TROW as we are forecasting negative organic growth in its upcoming earnings print on October 23rd versus the Street's ongoing positive growth estimates (see our Best Ideas research below)


Hedgeye Best Ideas TROW Short Research
Hedgeye Best Ideas JNS Short Research
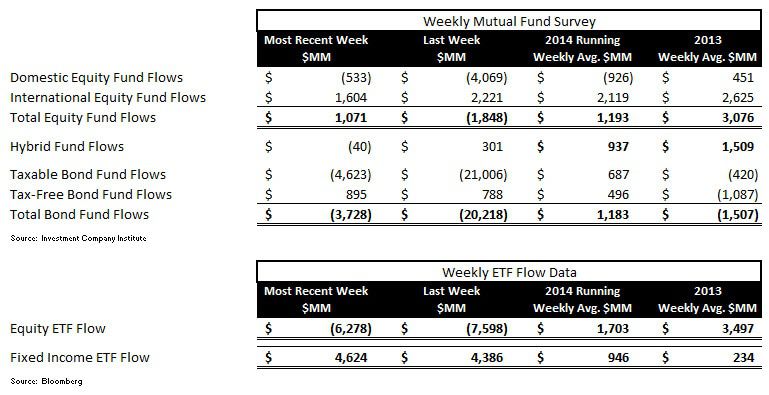
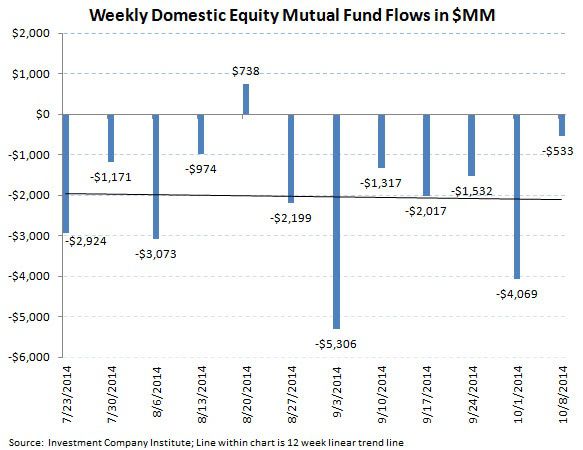
In the most recent 5 day period ending October 8th, total equity mutual funds put up moderate inflows with $1.0 billion coming into the total equity fund category according to the Investment Company Institute. The composition of the inflow continued to be weighted towards International stock funds with a $1.6 billion inflow buffering another outflow of $533 million in U.S. stock funds. The inflow into International stock funds made it a perfect 40 for 40, i.e. inflows in all 40 weeks of 2014. Conversely, domestic trends continue to be very soft with now 23 of 24 weeks of outflow now totaling over $57 billion lost. The running year-to-date weekly average for all equity fund flow continues to decline and now settles at a $1.1 billion inflow, now well below the $3.0 billion weekly average inflow from 2013.
Fixed income mutual fund flow had another drawdown in the most recent ICI data succumbing to more net selling from the dislocation at large bond fund manager PIMCO. Total bond funds lost another $3.7 billion last week with the distribution focused with the taxable bond fund category which lost another $4.6 billion last week. Despite the taxable outflow, intermediate term trends are still quite positive however for taxable fixed income with 29 of the past 35 weeks having had positive subscriptions. Municipal or tax-free bond funds in the most recent survey put up a $895 million inflow, making it 34 of 35 weeks with positive subscriptions. The 2014 weekly average for fixed income mutual funds now stands at a $1.1 billion weekly inflow, an improvement from 2013's weekly average outflow of $1.5 billion, but still a far cry from the $5.8 billion weekly average inflow from 2012 (our view of the blow off top in bond fund inflow).
ETF results were mixed during the week with substantial outflows into equity funds but subscriptions in passive fixed income products mopping up the ongoing redemption in taxable bond funds. Equity ETFs suffered a $6.2 billion redemption while fixed income ETFs put up a $4.6 billion subscription, the biggest inflow in almost 5 months. The 2014 weekly averages are now a $1.7 billion weekly inflow for equity ETFs and a $946 million weekly inflow for fixed income ETFs.
The net of total equity mutual fund and ETF trends against total bond mutual fund and ETF flows totaled a negative $6.1 billion spread for the week (-$5.2 billion of total equity outflow versus the $896 million inflow within fixed income; positive numbers imply greater money flow to stocks; negative numbers imply greater money flow to bonds). The 52 week moving average has been $3.5 billion (more positive money flow to equities), with a 52 week high of $27.2 billion (more positive money flow to equities) and a 52 week low of -$37.5 billion (negative numbers imply more positive money flow to bonds for the week). The 52 week moving average chart displays the declining demand for all equity products (funds and ETFs) for the safety and security of fixed income.
Mutual fund flow data is collected weekly from the Investment Company Institute (ICI) and represents a survey of 95% of the investment management industry's mutual fund assets. Mutual fund data largely reflects the actions of retail investors. Exchange traded fund (ETF) information is extracted from Bloomberg and is matched to the same weekly reporting schedule as the ICI mutual fund data. According to industry leader Blackrock (BLK), U.S. ETF participation is 60% institutional investors and 40% retail investors.

Most Recent 12 Week Flow in Millions by Mutual Fund Product:


Most Recent 12 Week Flow Within Equity and Fixed Income Exchange Traded Funds:


Net Results:
The net of total equity mutual fund and ETF trends against total bond mutual fund and ETF flows totaled a negative $6.1 billion spread for the week (-$5.2 billion of total equity outflow versus the $896 million inflow within fixed income; positive numbers imply greater money flow to stocks; negative numbers imply greater money flow to bonds). The 52 week moving average has been $3.5 billion (more positive money flow to equities), with a 52 week high of $27.2 billion (more positive money flow to equities) and a 52 week low of -$37.5 billion (negative numbers imply more positive money flow to bonds for the week). The 52 week moving average chart displays the declining demand for all equity products (funds and ETFs) for the safety and security of fixed income.

Jonathan Casteleyn, CFA, CMT
Joshua Steiner, CFA