This note was originally published October 14, 2014 at 10:29 in Macro
This market does not trust Draghi’s Drugs! (Draghi is European Central Bank President Mario Draghi.)
Below we show recent data points that are supportive our Q4 Macro Theme #EuropeSlowing. Here’s an update on the latest Eurozone experiment:
- Draghi’s policy to inflate has only resulted in deflation (France and Italy CPI in September fell 10bps to 0.4% Y/Y and -0.1% Y/Y, respectively)
- BOTH the periphery and the core are contributing to the regional slowing
- The gap between Germany’s fiscal policy stance and France and Italy is widening
- There remains no singular voice from the ECB on the merits of its policy actions to produce sustainable economic growth
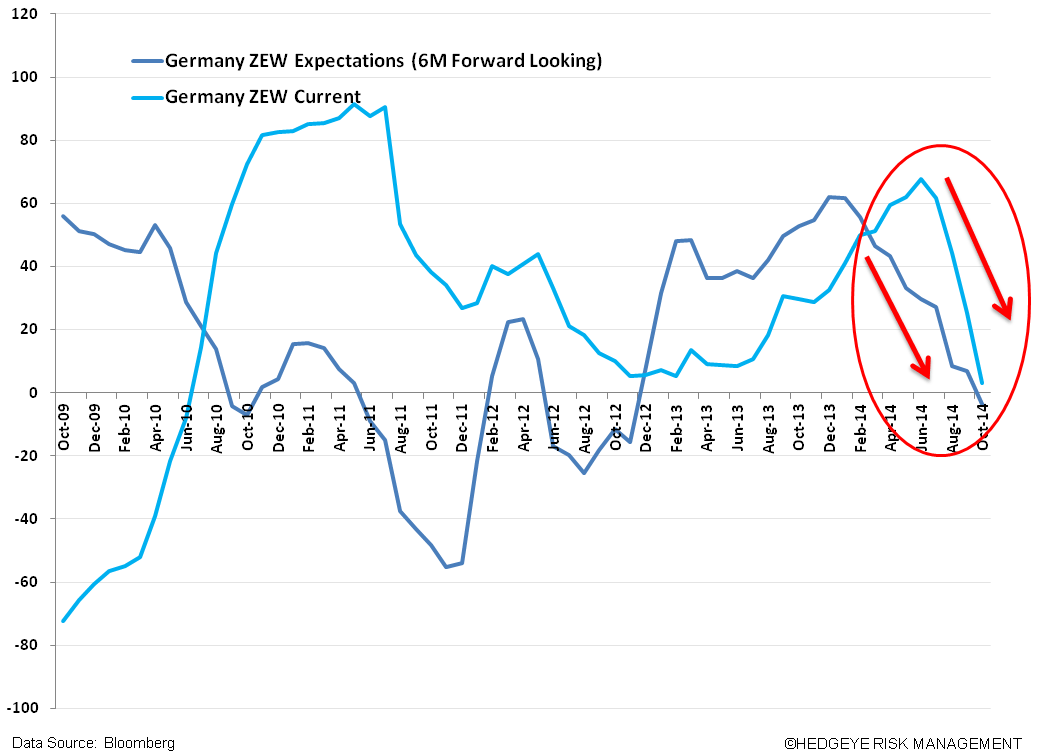
We’ll let the recent data from the region’s economic heavyweight speak for itself, #EuropeSlowing:
- The German Government lowered its GDP forecast (leaked on Friday) to 1.2% in 2014 (vs 1.8% prior); and 1.3% in 2015 (vs 2.0% prior)
- Germany ZEW Economic Growth Expectations in October hit a 2 year low
- German Exports in August (down -5.8% M/M) largest fall in more than 5 years
- German Factory Orders fell -1.3% in August Y/Y
- German Industrial Production in August weakest reading in more than 5 years
- German Bunds are making all time lows @ 0.855% and down 101 bps Y/Y
From an investment position, we are recommending shorting French (EWQ) and Italian (EWI) equities and the EUR/USD (FXE).