“It would be nice to think that such bad behavior will never happen again.”
-Daniel Alpert
Some people are nice in this business. Some people are mean. I tend to be nice to subscribers, children, and dogs. I guess I have a not so nice tweet-streak in me for pundits who aren’t accountable. Hockey players can be mean that way.
The aforementioned quote comes from a non-hockey-non-consensus economics book I have been waiting to review called The Age of Oversupply, by Dan Alpert from Westwood Capital. It’s an outside the box, but reasonable way to consider #deflation.
Dan is one of the nice guys who holds himself accountable to his clients. He is also on a short list of people who were appropriately bearish on things like supply in 2008. The main contention in his book is that oversupply is here to stay. That appears right, for now.
Back to the Global Macro Grind…
Some of the #MoBros on Twitter have been calling me a meany for calling their levered-long-momentum positions in small cap and/or social (non profit publicly listed companies) stocks #Bubbles. But Dan is down with that – he calls them what they are too.
“The Great Credit Bubble may have burst, but the age of oversupply hasn’t ended – and won’t anytime soon. Abundant labor, excess capital, and cheap money are here to stay.” (The Age of Oversupply, pg 18)
By my math, the only way to unwind the excess and stupid-valuation-storytelling associated with these cheap moneys is via lower prices for #bubble stocks. Yesterday’s US stock market volume was revealing on that front:
- Total US Equity Market Volume (total exchange + OTC + OTCBB) was +6.2% vs. its 3 month average
- Total Exchange Volume was +44% vs. its 3 month average
- Total Traded Value (Russell 3000) was +30% vs. its 4 month average
That’s three different ways we try to look at equity market volume in real-time. When it comes to the pick-toggling junk bond #bubble, finding real-time volume read-throughs is more like finding Waldo.
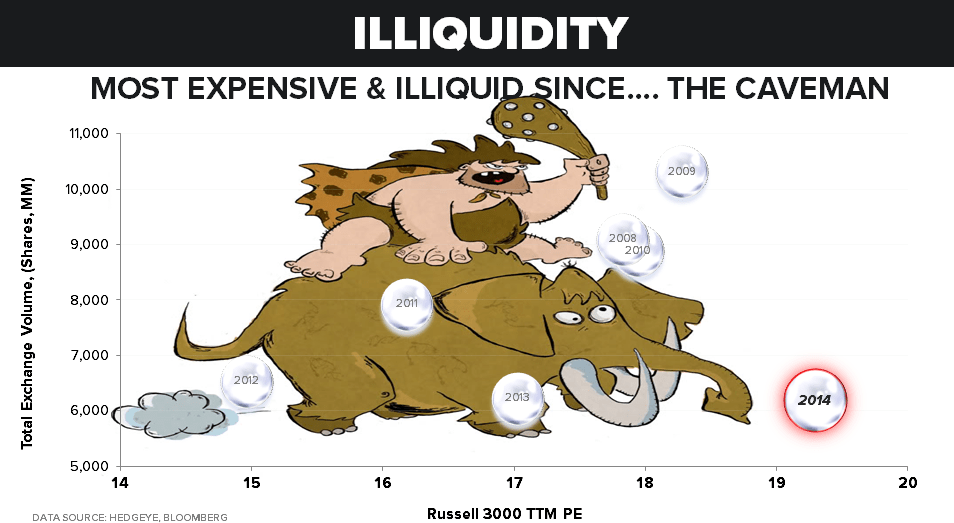
Today’s Chart of The Day (exhibit 51 in our Q4 Macro Themes deck) is a picture of what I am trying to hammer home in terms of the relationship volume has with inflated prices – Total Exchange Volume vs Russell 3000 TTM P/E multiple.
Punch-line: this is the most expensive and illiquid market since the caveman.
“So” how does expensive illiquidity sync with oversupply of labor, capital, etc.? Unfortunately, when Japanese, European, and US growth is slowing (all at the same time), I think what that means is pretty straightforward:
- Deflation of illiquid equity bubbles
- Re-flation of premiums paid for liquidity (JGBs, Bunds, Treasuries)
- And a whole whack of revisionist sell-side economics excuse-making along the way
You see, until this market snapped the backs of the Moving Monkeys (point and click single-factor time/price charts using things like the “50 and 200 day” moving averages), they didn’t have to pay attention to things like books, volume, or volatility.
After a +138% rip in US equity volatility (VIX since the Russell #Bubble topped on July 7th, 2014), they need to start reading!
To be clear on timing, since we’re now probing:
A) Immediate-term TRADE overbought signals in VIX (risk range = 17.78-24.98)
B) Immediate-term TRADE oversold signals in SPX and RUT (SPX risk range = 1)
I don’t want you to be shorting US stocks and buying TLT with the 10yr Yield at its YTD lows (2.21%) today.
I just want you to, objectively, rewind the risk management tapes and learn something from what a baseline 3-factor model (price, volume, and volatility) was signaling for, well, most of 2014.
For OCT to-date, the #Quad4 deflation in US equity sector styles levered to inflation and/or growth expectations looks like this:
- Energy Stocks (XLE) down -10.65%
- Basic Material Stocks (XLB) down -9.03%
- Industrial Stocks (XLI) down -6.79%
That’s precisely what you should see in #Quad4. Mr. Market is telling you that both growth and inflation expectations are slowing, at the same time. Unless you are overweight Cash, Treasury Bonds, and Munis, that is not #nice portfolio behavior.
Our immediate-term Global Macro Risk Ranges are now:
UST 10yr yield 2.20-2.39%
SPX 1
RUT 1042-1081
VIX 17.78-24.98
USD 84.99-86.64
Gold 1211-1241
Best of luck out there today,
KM