QUANT SET-UP
Natural Gas is currently neutral on a @Hedgeye TREND Duration after testing, and moving below its $3.89 TREND Line of support late last week. The long-term TAIL line sits at $4.16.
------
Dry natural gas from shale formations continues taking share of overall production in the U.S., and this is expected to continue. Shale Gas has become the most important unconventional energy source because of the large amount of recoverable reserves:
- Natural Gas from shale formations accounts for 40% of all U.S. natural gas produced, and this is expected to increase to 53% by 2040 according to EIA estimates
The increase in domestically available natural gas resources will benefit manufacturing industries that rely heavily on natural gas as a fuel or feedback:
- The U.S. has approximately 31 Years of current aggregate domestic natural gas production in technically recoverable shale reserves (assuming all natural gas produced is from shale; ~60 years of recoverable reserves at peak estimated production levels)
------
In our first note on the subject, we outlined some of the regulatory and capacity obstacles to becoming an LNG exporter:
Can The U.S. Shale Boom Be Stopped?
Highlights from the Note:
- New law governing the LNG Terminal Approval Process enacted in August:
- Simplifies approval process (less steps)
- Shortens Approval Process
- Currently, three projects have received approval for construction:
- Sabine Pass (Cheniere Energy) in Louisiana was the first approved and generous estimates are that the end of 2015 for first exporting may be possible
- Cameron Parish (Cameron-subsidiary of Sempra Energy) in Louisiana authorized to export the equivalent of 1.7bn cubic feet/day for a period of 20 years. Project expected to be completed by 2018
- Martin Country (Carib Energy) in Florida expected to be able to export 40M cubic feet/day
------
Aside from regulation hindering our ability to become an exporter, what factors can prevent our domestic potential to reap the benefits of this seemingly plentiful production capacity?
In this note we’ll look at the positive evolution of marginal production efficiency fighting against structural transportation constraints creating larger gas premiums in some parts of the country.
Many domestic industries benefit from the increase in U.S. natural gas production:
- Petrochemicals, fertilizer, and synthetic resins
- iron and steel
- Various energy intensive industries such as glass, paper and pulp, and plastics packaging
These industries make-up approximately 18% of total manufacturing output in the United States. Downstream, energy-intensive manufacturing industries that use natural gas a fuel or feedstock could increase production with lower fuel costs. However, with the lower profit margins from non-traditional shale plays, the profitability of projects is much more susceptible to energy price volatility. The average shale play in the U.S. is profitable at an oil price of $65/BOE, but in some of the higher cost regions, the $85-$90 range is a break-even price:
STRUCTURAL OBSTACLES VS. INCREASED EFFICIENCY
I) INFRASTRUCTURE OBSTACLES: Capital Intensive and sticky without the margin guarantee (Invest now, benefit later)
- Midstream and Downstream infrastructure (pipelines, storage, refineries), as well as adequate water supplies are necessary for a shale revolution to exist:
The onsite production is ramping-up across the country, but refining and transportation availability is lacking causing large premiums in those regions where it’s difficult to distribute resources. Developing the infrastructure requires time, and the profitability of each project is at the mercy of unpredictable oil and gas prices.
- Pipelines are mostly made of steel and cost between $2.8 and $15 million per mile:
Below is an example of the upfront capital equipment required for a project that will hopefully bring a future benefit to a producer:
Marginal production costs in the Utica and Marcellus regions is in the $2 range and NYMEX Jan. nat. gas futures are trading around $4. (we’ll use the widest spread possible for illustrative purposes).
January nat. gas for delivery in New England is around $15. If a producer in Utica could produce and refine for, call it $3, the spread is $12, so why not build a pipeline? Assume a pipeline was built from Harrison, WV to Boston (656 miles) at $3M/mile (low-end of the cost structure). The all in cost is $1.96Bn. Some of the gas could be transferred via existing pipelines, but most are already operating at full capacity. Since a pipeline costs an estimated $2.8m-$15m, we’ll discount the $1.96Bn to $1.75Bn (we already used the low-end of the range for laying pipeline).
A project that costs $1.75Bn upfront when no profits will be realized for years into the future is hard to justify, let alone hedge.
- As production of oil and gas outpaces pipeline capacity, railroads have filled the gap to a certain extent:
- Carloads from ‘08 to ‘12 increased by close to 200,000
- Crude oil and petroleum product shipped by rail increased 46% from 2011 to 2012
- 75% of oil leaving North Dakota is shipped by truck to railcars
The U.S. shale revolution has caused an excess of oil and gas shipped via railway that is clogging the transportation of agricultural products to U.S. ports. With record grains crops, transporting the supply to ports is proving difficult from a logistical standpoint.
- “While the U.S. will reap the most crops ever, fourth-quarter export cargoes will be 15% lower than last year, according to RS Platou Markets AS, a Norwegian bank specialized in shipping. “
- The Association of American Railroads says crude moved by rail almost doubled last year. The bottlenecks may persist because the Energy Department is predicting the most oil output in 45 years in 2015.
- Railroad congestion has been a problem for grain handlers, Arthur Neal, a deputy administrator for transportation and marketing at the USDA, told a Senate committee during a hearing on Sept. 10. Since October 2013, the USDA has reported delays, missed shipments, backlogs and higher costs for railroad services for U.S. grain shippers, Neal testified.
II) INCREASED EFFICIENCY WITH THE UTICA SHALE FORMATION NOW LEADING THE WAY WITH SOME OF THE MOST PRODUCTIVE ACREAGE
Expansion in the industry is very susceptible to a drop in nat. gas prices, and the lowest cost producers, who are very selective of the projects they undertake, will survive. Natural gas prices are definitely a burden on producers, but are production costs coming down with an increase in efficiency?
Although an increase in overall drilling has ceased, the production of natural gas has increased dramatically. Companies can produce 6x the amount of natural gas they could from the same well in 2010. Smarter, more efficient drilling and better technology have contributed to the increase in well productivity in the last few years. The Utica formation has come along next to Marcellus in the Northeast to become the most productive acreage in the country:
- Cost of well in Marcellus was $10M in 2010 and it is now approximately $7M.
- Marcellus and Eagle Ford have been the best formations for extracting shale gas; Utica is now taking the spot as the most efficient formation
- At the same time the cost of drilling a well is decreasing, drilling productivity from each new well is increasing rapidly:
- Drilling productivity in the Utica region has increased from 0.3 MMcf/Day in January of 2012 to an estimated 5.0MMcf/Day by August 2014.
- This growth rate outpaced the growth rate in both the Haynesville and Marcellus regions during their fastest periods of growth (2009-11 for Haynesville and 2010-12 for Marcellus)
- Utica is the fastest-growing region with the lowest marginal cost of production reported in the U.S.:
Rankings of Marginal Production Costs of U.S. Shale Plays (Lowest to Highest):
- Utica
- Southwest Marcellus
- Permian
- Northeast Marcellus
- Eagle Ford
- Granite Wash
- Niobrara
- Barnett
- Haynesville
Rankings of Natural Gas Production per New Rig (Highest to Lowest):
- Marcellus
- Haynesville
- Utica
- Niobrara
- Eagle Ford
- Bakken
- Permian
In 6 out of 7 of the major shale gas producing regions (these 7 make-up 95% of domestic production), the ratio of rig count/new-well production per rig has declined dramatically proving the great strides from a production efficiency standpoint.
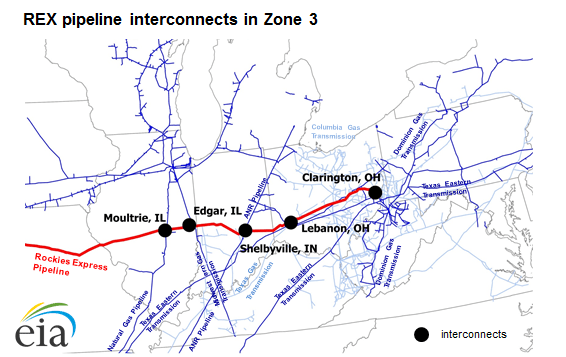
With newly developed refining capacity in the Utica and Marcellus Shale, and the westbound service offered in Zone 3 of the REX pipeline (via the Seneca Lateral Pipeline), the low-cost production offered from these regions can now be utilized. An increasing amount of natural gas is being gathered and processed to meet pipeline specifications, allowing the gas to flow on interstate pipelines.

CONCLUSION: Now that the refining and transportation capacity is developed, continued growth in Marcellus and Utica will be fueled by both the geological properties of the Utica formation and the evolution of horizontal drilling and hydraulic fracturing expertise after nearly 10 years of drilling shale and tight formations.
The sell-off in oil and natural gas prices testing higher cost shale plays will differentiate those producers with the most efficient projects in the lower cost regions.
Please feel free to reach out with any comments or questions.
Ben Ryan
Analyst
