Investment Company Institute Mutual Fund Data and ETF Money Flow:
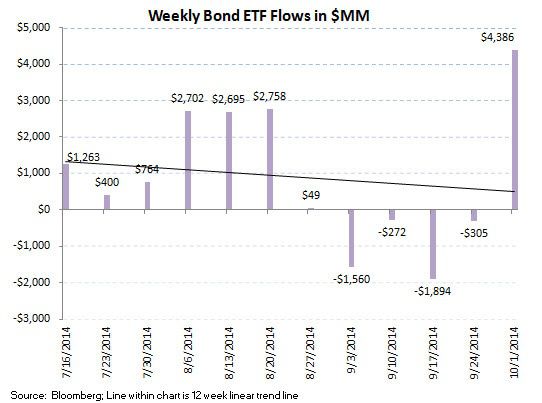
The most recent weekly ICI fund flow survey put a wrap to data for the third quarter which marked the worst underlying trends for domestic equity fund flows since the fourth quarter of 2012. In aggregate, U.S. stock funds experienced over $28 billion in redemptions in the most recent quarter, the biggest withdrawal since the $56 billion drawn down in 4Q 2012. While international equity trends cushioned the blow during the period with $24 billion of inflow, the net equity result was still the worst since the end of '12. We continue to be very cautious on the two main proxies for U.S. equity fund flow trends, shares of T Rowe Price (TROW) and Janus Capital (JNS), especially considering that seasonally the fourth quarter has historically been worse than all third quarters since 2007 (see seasonal ICI trends here). On a weekly basis, the ICI reported the biggest ever redemption in the taxable bond category, which reflects the substantial dislocation as a result of the movement of Bill Gross from PIMCO to Janus. Interestingly, fixed income ETFs put up a $4.3 billion inflow last week, well over the 52 week average of a $852 million inflow, mopping up some of the knee jerk reaction out of PIMCO taxable bond funds. As far as an update on our call that the implied inflow to Janus on the Bill Gross addition is a market overreaction, a major media outlet reported that Gross' new fund took in $66 million in the first two days of operation this week which would imply an annual net of $8 billion in new assets-under-management ($33 million per day at 250 trading days). This is still a far cry from our calculation of implied impact of over $40 billion in AUM. We continue to maintain shares of TROW and JNS on our Best Ideas short list supported by this most recent industry data (see links to our reports below). Despite the industry's best investment performance, TROW equity fund flow data has not been immune to the broader ICI industry level weakness (regression between the two data sets below), and thus the worst quarter in a year and a half with the seasonally weak fourth quarter ahead, is reason for concern.


Hedgeye Best Ideas TROW Short Research
Hedgeye Best Ideas JNS Short Research
Total equity mutual funds in the most recent 5 day period ending October 1st experienced $1.8 billion in redemptions according to the Investment Company Institute. The composition of flow trends continued to be weighted towards International stock funds with a $2.2 billion inflow buffering another meaningful outflow of $4.0 billion in U.S. stock funds. The inflow into International stock funds made it a perfect 39 for 39, i.e. inflows in all 39 weeks of 2014. Conversely, domestic trends continue to be very soft with now 22 of 23 weeks of outflow now totaling over $56 billion lost. The running year-to-date weekly average for all equity fund flow continues to decline and now settles at a $1.1 billion inflow, now well below the $3.0 billion weekly average inflow from 2013.
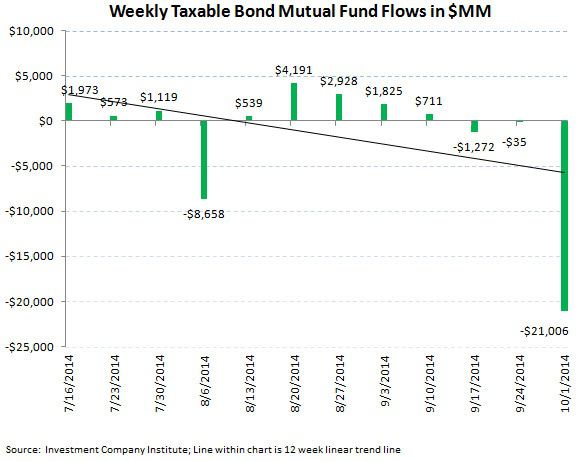
Fixed income mutual fund flow had a substantial purge in the most recent ICI data, booking the biggest weekly outflow in the taxable bond category in the history of the public reporting of the data. Within the most recent survey, over $21 billion was redeemed last week in taxable bonds, just surpassing the weekly redemption of $20.4 billion during the "Tapering Tantrum" in June 2013 (see ICI press release here). The ICI specifically addressed this as "having no discernable impact on broader financial markets" without naming a driver of the outflow. In matching up industry events with this redemption, the dislocation at PIMCO with Bill Gross leaving the $200+ billion Total Return Fund was to blame. We expect there will be a trailing impact on the category for the rest of the fourth quarter as the industry adjusts to this development. Intermediate term trends are still quite positive however for taxable fixed income with 29 of the past 34 weeks having had positive subscriptions. Municipal or tax-free bond funds in the most recent survey put up a $788 million inflow, making it 33 of 34 weeks with positive subscriptions. The 2014 weekly average for fixed income mutual funds now stands at a $1.3 billion weekly inflow, an improvement from 2013's weekly average outflow of $1.5 billion, but still a far cry from the $5.8 billion weekly average inflow from 2012 (our view of the blow off top in bond fund inflow).
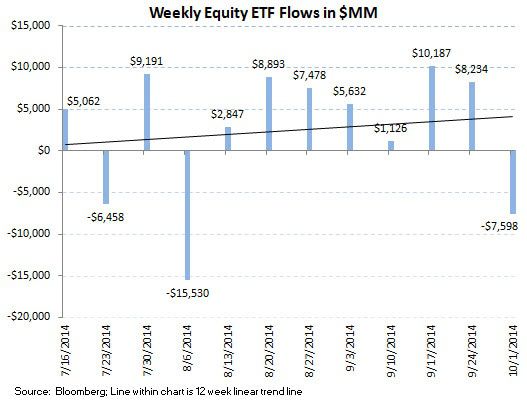
ETF results were mixed during the week with substantial outflows into equity funds but subscriptions in passive fixed income products mopping up the substantial snap redemption in taxable bond funds. Equity ETFs suffered a $7.5 billion redemption, the biggest outflow in 2 months, while fixed income ETFs put up a $4.3 billion subscription, the biggest inflow in almost 5 months. The 2014 weekly averages are now a $1.9 billion weekly inflow for equity ETFs and a $852 million weekly inflow for fixed income ETFs.
The net of total equity mutual fund and ETF trends against total bond mutual fund and ETF flows totaled a positive $6.3 billion spread for the week (-$9.4 billion of total equity outflow versus the -$15.8 billion outflow within fixed income; positive numbers imply greater money flow to stocks; negative numbers imply greater money flow to bonds). The 52 week moving average has been $3.6 billion (more positive money flow to equities), with a 52 week high of $27.2 billion (more positive money flow to equities) and a 52 week low of -$37.5 billion (negative numbers imply more positive money flow to bonds for the week). The 52 week moving average chart displays the declining demand for all equity products (funds and ETFs) for the safety and security of fixed income.
Mutual fund flow data is collected weekly from the Investment Company Institute (ICI) and represents a survey of 95% of the investment management industry's mutual fund assets. Mutual fund data largely reflects the actions of retail investors. Exchange traded fund (ETF) information is extracted from Bloomberg and is matched to the same weekly reporting schedule as the ICI mutual fund data. According to industry leader Blackrock (BLK), U.S. ETF participation is 60% institutional investors and 40% retail investors.

Most Recent 12 Week Flow in Millions by Mutual Fund Product:


Most Recent 12 Week Flow Within Equity and Fixed Income Exchange Traded Funds:
Net Results:
The net of total equity mutual fund and ETF trends against total bond mutual fund and ETF flows totaled a positive $6.3 billion spread for the week (-$9.4 billion of total equity outflow versus the -$15.8 billion outflow within fixed income; positive numbers imply greater money flow to stocks; negative numbers imply greater money flow to bonds). The 52 week moving average has been $3.6 billion (more positive money flow to equities), with a 52 week high of $27.2 billion (more positive money flow to equities) and a 52 week low of -$37.5 billion (negative numbers imply more positive money flow to bonds for the week). The 52 week moving average chart displays the declining demand for all equity products (funds and ETFs) for the safety and security of fixed income.

Jonathan Casteleyn, CFA, CMT
Joshua Steiner, CFA