Our Hedgeye Housing Compendium table (below) aspires to present the state of the housing market in a visually-friendly format that takes about 30 seconds to consume.
*Note - to maintain cross-metric comparability, the purchase applications index shown in the table below represents the monthly average as opposed to the most recent weekly data point.

Today's Focus: MBA Mortgage Applications & August Construction Spending
MBA Mortgage Applications
The Mortgage Bankers Association today released its weekly mortgage applications survey data for the week ended September 26th.
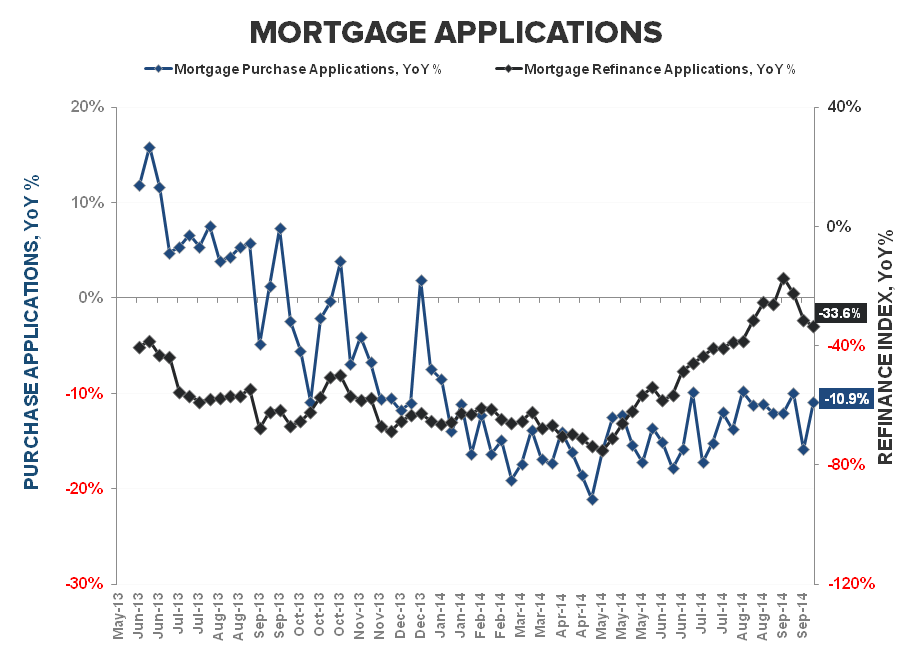
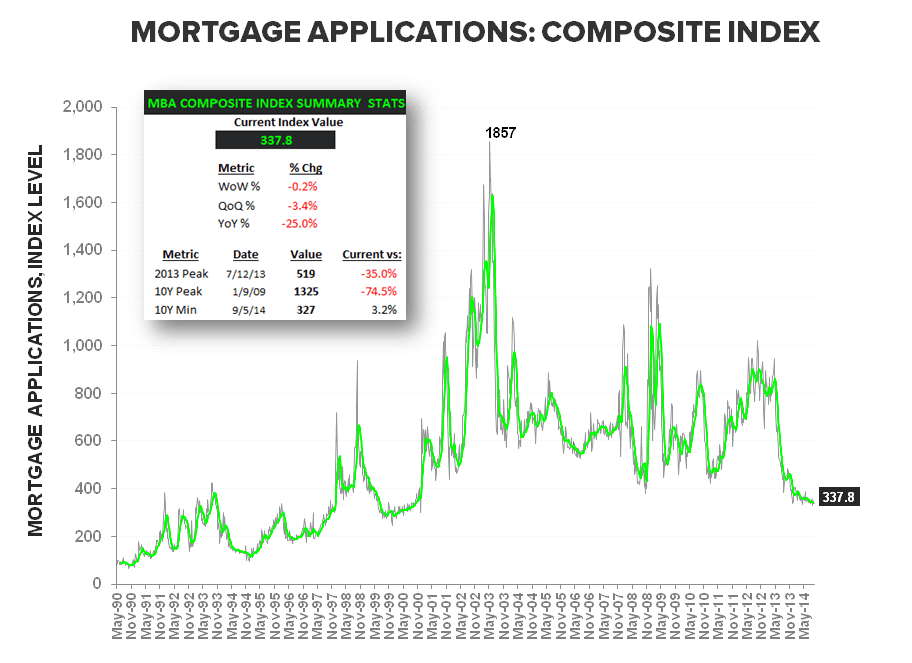
- Mortgage Applications fell -0.2% as Purchase demand was flat sequentially and refi activity declined -0.29% despite the dip in rates.
- Purchase Applications: Purchase volume was unchanged WoW as the index held below the 170-level for a 12th consecutive week. Purchase Activity declined -6.2% QoQ as demand declined to its lowest level since 2q of 1995. On a year-over-year basis, purchase applications improved to -10.9% from -15.9% prior as we lapped the last hard compare of the year. From here, the YoY comps remain negative and get progressively easier through the balance of 2H.
- Refinance activity declined -0.2% as rates on the 30Y FRM contract dropped -6bps to 4.33%. On a year-over-year basis Refi volume worsened for a second week to -33.6% YoY despite increasingly easy compares.


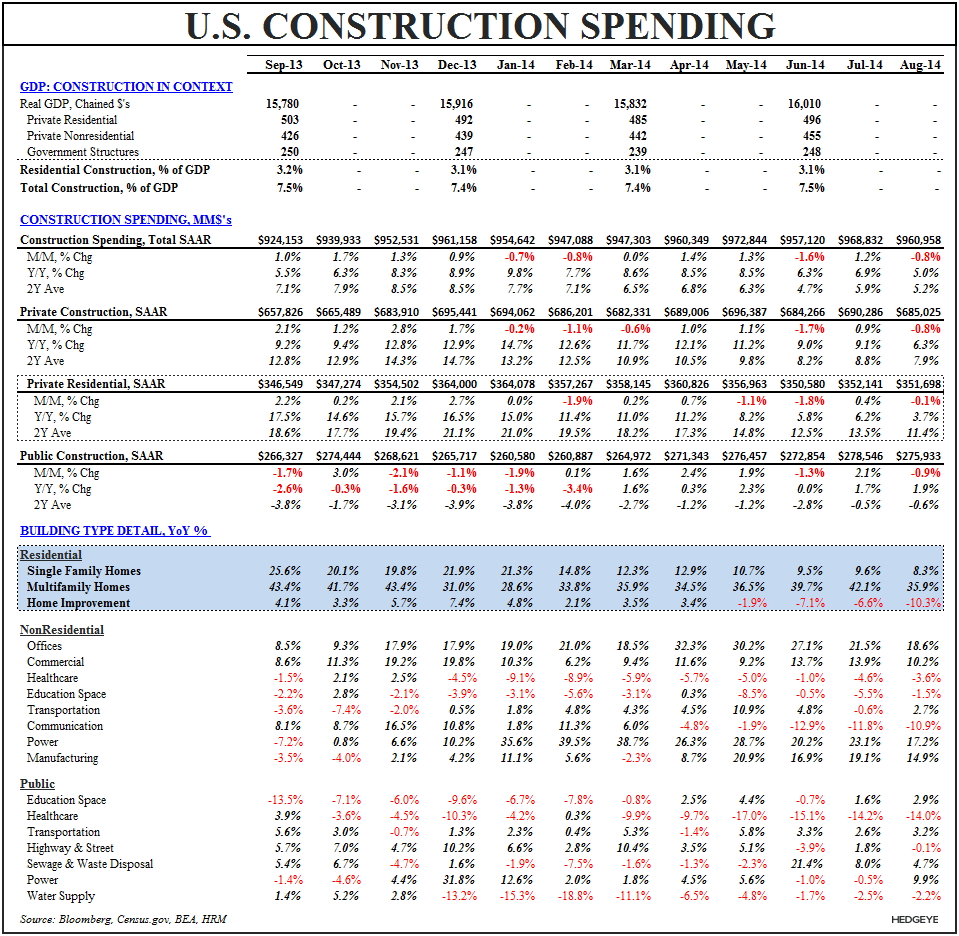
CONSTRUCTION SPENDING (AUG)
Total Construction spending slowed -0.8% MoM in August with July revised down -60bps to +1.2%.
The first estimate for private residential construction showed spending slowed -0.1% MoM while decelerating on both a 1Y and 2Y basis. Expenditure growth slowed across each of Single-family, Multi-family and Home Improvement categories with the 4th consecutive month of (accelerating) negative growth in home improvement the most notable.
On the nonresidential side, construction spending on commercial, office and manufacturing structures remained strong in August although each slowed modestly sequentially. The nonresidential construction numbers extend the solid growth in private investment in structures reported in 2Q GDP and continue to accord with both the strong C&I/CRE loan growth figures in the Feds’ H8 data and the positive senior loan officer commentary.


About MBA Mortgage Applications:
The Mortgage Bankers’ Association’s mortgage applications index covers more than 75% of mortgage applications originated through retail and consumer direct channels. It does not include loans delivered through wholesale broker and correspondent channels. The MBA mortgage purchase applications index is considered a leading indicator of single-family home sales and construction. Moreover, it is the only housing index that is released on a weekly basis.
Frequency:
The MBA Purchase Apps index is released every Wednesday morning at 7 am EST.
Joshua Steiner, CFA
Christian B. Drake
