Our Hedgeye Housing Compendium table (below) aspires to present the state of the housing market in a visually-friendly format that takes about 30 seconds to consume.

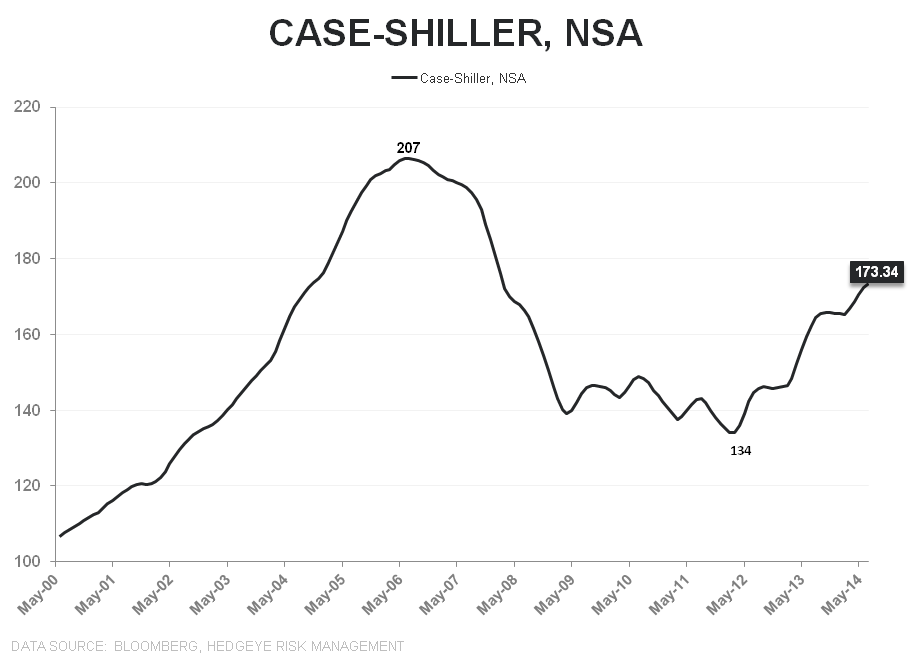
Today's Focus: July S&P/Case-Shiller Home Price Report
Key Takeaways
Home price growth as measured by the Case-Shiller 20-city composite decelerated -140bps sequentially to +6.7% YoY. The slowdown in July represents the 8th consecutive month of deceleration and the 2nd consecutive month of flat or declining growth across all cities.
As a reminder, the Case-Shiller HPI series is constructed as a 3-month moving average so the July release reflects HPI changes over the May-to-July period, effectively amounting to June data. With July data from Corelogic in hand for almost a month already, we knew the slope and likely magnitude of the deceleration for Case-Shiller in July. We should get the Corelogic home price report for August (along with their best econometric guess for September) in the next day or two, which will be the far more important report.
As we highlighted last month (Corelogic HPI - THE DILEMMA), the abrupt, positive inflection in the 2nd derivative HPI as reported by Corelogic was notable because, historically, equity prices across the housing complex have followed the slope in home price growth very tightly.
Given the embedded lag in the Case-Shiller data, we’ll have to wait for next month’s release for corroborating evidence of the fledgling inflection in the Corelogic series.


Bottom Line:
Housing-related equities follow the path of HPI. So long as HPI is decelerating, housing equities will move sideways to lower. We can forecast HPI's path by looking at demand trends on a 12-18 month lead/lag basis. Our expectation is that prices continue to decelerate throughout 2H14 and potentially into 1H15.
About Case Shiller:
The S&P/Case-Shiller Home Price Index measures the changes in value of residential real estate by tracking single-family home re-sales in 20 metropolitan areas across the US. The index uses purchase price information obtained from county assessor and recorder offices. The Case-Shiller indexes are value-weighted, meaning price trends for more expensive homes have greater influence on estimated price changes than other homes. It is vital to note that the index’s printed number is a 3-month rolling average released on a two month delay.
Frequency and Release Date:
The S&P/Case-Shiller HPI is released on the last Tuesday of every month. The index is on a two month lag and therefore does not reflect the most recent month’s home prices.
Joshua Steiner, CFA
Christian B. Drake
