Earlier today, we sent out the EM sell signals in our MACRO PLAYBOOK one pager with the following conclusions:
- VWO (Vanguard Emerging Markets ETF) broke @Hedgeye TREND support yesterday
- TACRM generating a high-conviction “SELL” for EM equities with major downside given the crowd-chasing out-performance over the last 6-months
- SELL: China (ETF: FXI), India (ETF: EPI), and Copper (ETF: JJC)
- BUY: Muni-Bonds (ETF: MUB) and Domestic Mega Caps (OEF)
With regards to our copper position, the bearish fundamental thesis now has a catalyst:
- The recent turn in emerging market equities fueled by:
- deflationary pressure on USD denominated commodities in a QUAD 4 set-up in our internal GIP model (GROWTH AND INFLATION SLOWING)
Copper has gone through a BULLISH TO BEARISH TREND REVERSAL, and the fundamental supply/demand outlook over the longer-term supports the short copper thesis.
While a slowdown in the commodity fueled credit financing bubble in China and the expectation for a steady increase in global supply coming onto the market over the next two years have suggested lower prices for quite some time now, a 1) A BULLISH Quant set-up in Chinese equities fueled by the positive effects of monetary stimulus at the regional and local government level from Beijing; AND 2) a BULLISH quant set-up in copper, likely fueled by the Chinese catalyst (SEE BELOW), helped to support prices over the summer.
BOTH OF THESE TRENDS HAVE NOW REVERSED:
- Reduce Exposure: EM Equities
- SELL: Copper (BEARISH TREND)
Copper ($Spot):
TREND: $3.16
TAIL: $3.20

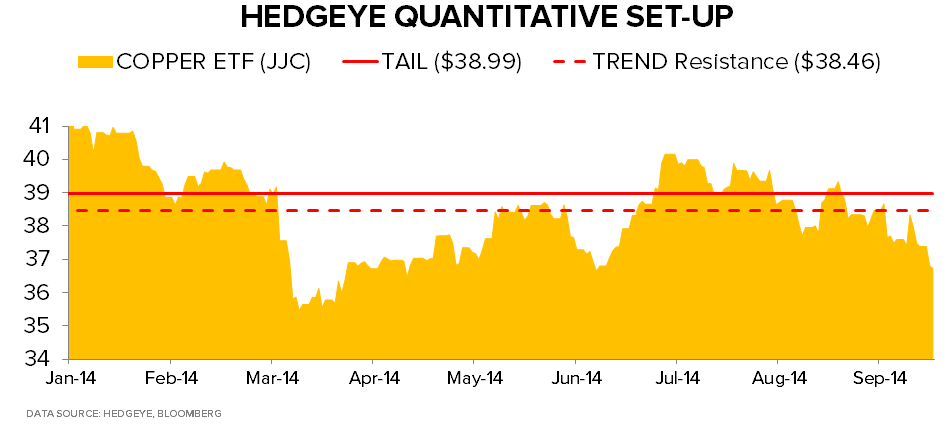
ETF: JJC
TREND: $38.46
TAIL: $38.99
With market activity working with the downside price move to confirm the bearish set-up, market activity and current sentiment suggest perception of the next catalyst has the ability to induce outsized moves in either direction.
PRICE
- 5-Day -3.2%
- 1-month: -5%
- YTD: -10.4%
VOLATILITY
- Implied volatility vs. trailing averages:
- -9.3% vs. 1-month
- -1.0% vs. 1-month
- -6.8% vs. 6-month
SENTIMENT
- CFTC Data showing a market that is chasing price but not overextended:
- Net Futures and Options Positions: -28% shorter week-over-week:
- -13.5K contracts vs. -577 1-year average (z-score=-0.85x)
Data showing the net positions from money managers reveals open interest is at a 7-week high:
- LME Money Manager Open interest: INCREASING
- Money Manager Longs % Open Interest: INCREASING
- Money Manager Shorts % Open Interest: DECREASING

The market as a whole is shorter as evidenced by the commitments of traders reports released Friday by the CFTC, but the speculative positions by large money managers is increasing. At the same time, volatility is being sold for less than its trailing averages. When this occurs, the probability increases for price movements that test critical capitulation levels compresses. The expectation for less volatility with larger, speculative size behind a market is the perfect set-up for more volatility on a catalyst.
- Bigger Positions: CFTC leaning farther short and money managers increasing open interest
- Implied Volatility being sold for less than trailing near-term averages
- Realized volatility lower than trailing averages
- Negative correlation risk vs. the U.S. dollar
While copper is down -10% on the year, we believe a cyclical downtrend has much farther to run over the next few years.
Please see the links below for two previous notes outlining the fundamental headwinds that will continue pressuring copper prices over the intermediate to long-term. We’ll follow-up with additional data supporting the call in the coming weeks. At the time of publication of these two notes, copper was in a BULLISH TREND set-up making the fundamental picture look obsolete.
The first note outlines China’s share of global base metals demand and proceeds to outline how the expectation for over-extended demand growth looks unsustainable from here.
COPPER A SCARY SHORT: WHERE WOULD YOU PUKE?
Highlights from the Note:
- CHINESE DEMAND: China consumes over 40% of the world’s industrial metals (up from 5% in 1980).
- 2013 Consumption (% global demand):
- Nickel: 47.4%
- Aluminum: 46.1%
- Zinc: 45.6%
- Copper: 42.4%
- INDUSTRIAL METALS TRADE ON THE OUTLOOK FOR CHINESE GROWTH: An equally weighted index of Chinese GDP and industrial production to industrial metals prices (CRB metals index) is running an r-squared of 0.50 currently, down from a December 2011 peak.
- COMMODITY FUELED CREDIT GROWTH (ADMITEDLY VERY ELUSIVE): Goldman Sachs estimates that $160Bn has flowed into China through commodity-backed loans since 2010. Regardless, the argument that this scandal has helped fuel an unsustainable credit boom has been labeled a bearish signal for base metals. A few cracks in the investigation by the Chinese government have found cracks in the bubble recently:
- Multiple parties using the same metal stockpiles as collateral
- Reports emerged last week that a major Chinese trading house is on the verge of insolvency
- Iron Ore Stockpiles at Qingdao port at lowest level since 2009
- INVESTMENT: China’s consumption to investment ratio (consumer demand/cap-ex ) is at historical highs:
- China: 0.7x
- USA: 3.5x
- UK: 4.6x
- Eurozone: 3.3x
- LEVERAGE:
- Aggregate debt level has reached 251% of GDP as of June which is a 20% increase from late 2013.
- Debt/GDP levels have increased 100% over the last five years
- China’s $26 trillion of debt is more than the entire commercial banking system of the U.S. and Japan combined
- DEMAND TO MEET SUPPLY FLOOD? On the supply side, an increase in late cycle mining cap-ex anchoring on steady demand from China moving forward requires an unsustainable amount of consumption from China if recent manufacturing and housing data is any indication:
In the following update at the end of August, copper was on the verge of breaking down. We highlighted Jakarta’s reversal to its copper bauxite export ban put in place in January. While Indonesia isn’t near the top of copper producing countries, China’s move to diversify supply lines elsewhere, and Indonesia’s mid-year lift on the ban will add to what we see as an excess amount of supply coming on over the next few years.
Is Indonesia's export Ban on Copper Bauxite Nearing a Resolution?
The following quote from the note highlights our conclusions:
“We will be watching the following factors in the coming weeks for a read-through on the supply outlook:
1) Chinese economic outlook takes a more definitive turn positive or negative
2) The Indonesian copper bauxite export picture reaches a long-term resolution
3) Continued confirmation in a late-cycle mining cap-ex push from the largest miners
4) A continued positive Trend for the USD
With these fundamental factors in play, copper may be interesting on the short-side if our @Hedgeye $3.16 TREND line breaks and confirms.”
This TREND Line of support did in fact break, and to re-iterate, copper is now BEARISH from an intermediate-term TREND perspective with $3.16 now a RESISTANCE level. With the quant now agreeing with the fundamental picture, we will look to short copper on the oversold risk management signals.
Please reach out with any comments or questions.
Ben Ryan
Analyst
