Below are Hedgeye analysts’ latest updates on our nine current high-conviction long investing ideas and CEO Keith McCullough’s updated levels for each.
We also feature three recent institutional research notes that offer valuable insight into the markets and the global economy.

Trade :: Trend :: Tail Process - These are three durations over which we analyze investment ideas and themes. Hedgeye has created a process as a way of characterizing our investment ideas and their risk profiles, to fit the investing strategies and preferences of our subscribers.
- "Trade" is a duration of 3 weeks or less
- "Trend" is a duration of 3 months or more
- "Tail" is a duration of 3 years or less
CARTOON OF THE WEEK

IDEAS UPDATES
TLT | EDV | XLU
Be prepared to get positioned defensively in the U.S. Quad #4 includes both economic growth and reported inflation slowing domestically. Based on negative reflections into Q3, i.e. slowdown of actual economic activity into 2H14, we notably caution investors that:
- Headline inflation: CPI is now averaging +1.85% on a YoY basis, down from average of 2.1% in Q2
- #ConsumerSlowing: Contrasting positive trends in both consumer credit and survey data, domestic consumption trend data shows ~70% of actual GDP that is Real PCE slowed to a +2% YoY in JUL
- Recent survey data from the Fed, shows Median US consumers are severely impacted by all-time highs in key expenditure buckets and #HousingSlowing due to slowing home price appreciation
- Labor market deterioration in recent months: the seasonally adjusted MoM nominal growth rate of Nonfarm Payrolls slowed sequentially to +141k in AUG
With both economic growth and reported inflation slowing domestically, we are now in a markedly different economic environment than what we saw in the second quarter. For the Q314 in particular, we see Real GDP growth in a range of +1.6% YoY to +1.8% YoY (that would translate to +1.3% on a QoQ SAAR basis) – i.e. less than half the rate of the Bloomberg consensus forecast of +3%.
We continue to expect a marginally dovish response from the Federal Reserve – particularly relative to near-consensus expectations of a tightening cycle commencing in 2H15. According to this week’s FOMC statement, a dovish Fed has revised their 2014 and 2015 Real GDP growth projections down +2.0% to 2.2% and 2.6 %to 3.0% respectively, narrowed their forecast for 2015 PCE Core Price Inflation to +1.6% to +1.9%, and failed to the remove the “considerable time” language in their Fed Fund Rate post the end of their large scale asset purchase programs.
From a tactical asset allocation perspective, our GIP model would suggest Quad #4 requires a defensive allocation. We think investors should be in bonds and defensive, bond-like equity exposure and out of both the domestic growth style factor(s) and inflation hedges. Note: Quad #4 is not a good place to buy REIT securities.
This is why we continue to favor TLT, EDV and XLU on the long side.
FXB
The voting results are in: the Scots squashed independence 55% NO to 45% YES, and with it we witnessed a relief bounce in the GBP/USD. As the chart below depicts, we fortuitously bought the bottom.

Over the medium term, we continue to like the cross based on what we see as relatively healthy underlying fundamentals for the country in 2H (to propel strong UK = strong Pound), versus our forecast for decelerating growth trends in the U.S. and Eurozone, combined with dovish policy expectations from central bank heads Mario Draghi and Janet Yellen.
This week we got encouraging high frequency data:
- UK Retail Sales rose 3.9% in August Y/Y vs 2.5% in the month prior
- UK ILO Unemployment Rate dropped 20bps to 6.2%
Recent BOE Minutes showed that for a second straight meeting there were 2 votes to increase interest rates (by 25 basis points). We expect this marginally more hawkish tone taken together with the outperformance of UK growth over the US and Eurozone in 2014 to push the GBP/USD higher.
GLD
Gold was for sale Wednesday from Janet Yellen’s 2:00p.m. statement, but the follow through was less confirmatory:
- Gold fell from $1236 to $1216 from the time she took the stage until after the close of U.S. markets at 4:00p.m.
- The U.S. 10-year yield ticked up ~7 bps over the same time period (continued higher Thursday)
- The U.S. dollar caught a solid bid finishing Wednesday +79bps

The gold market bounced slightly on the week off the Wednesday afternoon lows and the dollar pulled back on Thursday. The immediate reaction from the market suggests she used a more hawkish tone, but U.S. economic data this week certainly didn’t support this assumption:
- Building Permits m/m -5.6% August vs. -1.6% est.
- Housing Starts m/m -14.4% August vs. -5.2% est.
- CPI y/y +1.7% Aug. vs +1.9% est.
- Industrial Production m/m -0.1% Aug. vs. +0.3% est.
With central planners abroad forcing a weaker EURO YEN combating the Federal Reserve’s reaction to growth slowing and inflation missing, does the USD run vs. Gold sell-off have room to run into the end of the year? Our takeaway from Yellen’s commentary leads us to believe the non-consensus outlook for a marginally weaker dollar into Q4 remains intact:
- The conveyance of the timing for a rate hike did not change (the “considerable time” language remained)
- Growth expectations were cut as we expected (Full-year 2014 expectations are still below our internal forecasts)
- We are sticking with what has been a consistent and straightforward asset allocation in 2014:
- Long growth-slowing (Utilities and Long-term treasuries with an exhaustion of rates on the back end of the curve)
- Long gold from here on an easier fed/weaker USD vs. expectations
HCA
As we’ve been writing in recent weeks, the job from here is to keep our head on a swivel, monitor trends closely, and tread carefully as we approach the question of selling the stock. Incremental this week was a meeting with a very large holder of the stock (who remains very positive), a consumer survey, model review, and macro update.
Google Consumer Survey: We initiated a survey using Google’s Consumer Survey and have linked the results here. Initially, the survey is designed to capture a baseline value for future samples, but what we found was interesting. The results appear to explain one of the more confounding data relationships we have seen over the last 6 years, the inverse relationship between consumer confidence and medical spending. What has happened historically is that when consumer confidence is rising, medical spending is falling, and vice versa. In presenting this to institutional subscribers I often get raised eyebrows and in one case a laugh.
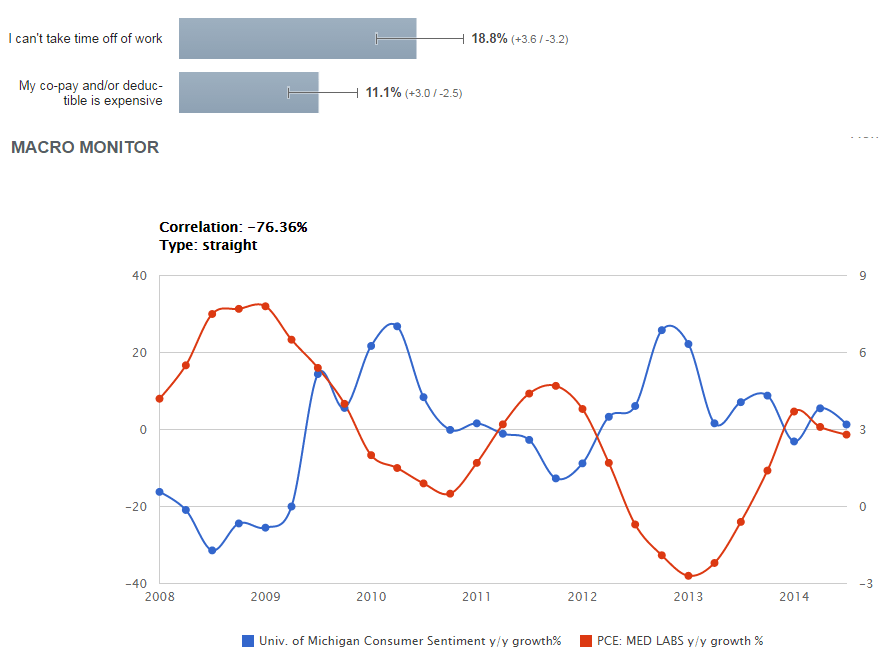
The survey shows why this strange relationship exists. The top ranked response to “If you have put off seeing a doctor, what is the main reason?” is “I can’t take time off of work” and was cited at 2X the rate over high co-pays and deductibles. The values in the table are for the entire sample population including Medicare beneficiaries, but for working age people, the difference is even greater. It would follow, as employment grows as it has, employees are busier and have less time to make doctor appointments. Consumer confidence becomes not the cause of slower medical spending, but a coincident indicator.
On the other items, we continue to see upside to 2015 consensus numbers in our model and massive cash flow generation while the macro updates for factors that drive their admissions and pricing continue to trend positively.
OC
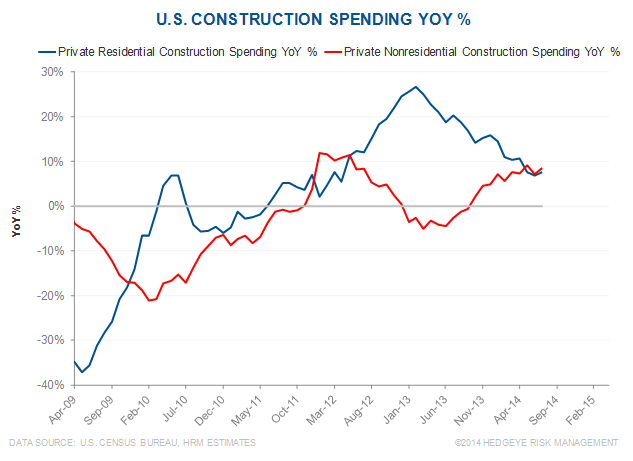
The Architecture Billings Index (ABI) is sitting at a post-financial crisis high of 55.8. The index is supposed to lead nonresidential construction activity by approximately 11 months. Nonresidential construction activity is still growing year-over-year per the latest U.S. Census Bureau data, but the residential side is diverging from nonresidential construction activity. While the NAHB Market Demand Index is sitting at a post-financial crisis high like the ABI, the divergence between sentiment and market conditions is noteworthy. Single family building permits actually decreased for August, while the Bureau’s residential data has been slowing since February 2013.
OZM
We view multi-strategy hedge fund products as more likely to generate positive returns moving into the later stages of this current bull market versus plain vanilla equity or fixed income portfolios.As the bull run in both bonds and stocks (fueled by an accommodating U.S. central bank) ages, the ability to reduce volatility in a portfolio by adding non-correlated assets and also short exposure should once again bring leading hedge fund products to the top of the table from a performance standpoint.
While hedge fund strategies have lagged broader benchmark returns including the S&P 500 over the past several years, across cycle over the past 20 years, leading hedge funds have produced much higher returns and lower volatility than benchmarks.
For example, since its inception in 1994, Och Ziff has had a compound annual growth rate in its investment performance of 13.4%. That's nearly 400 basis points better than the S&P 500 with compounded returns of 9.6%.

Furthermore, returns have been more stable at OZM over this 20-year period with a standard deviation of just 5.3%, almost 1/3 of the variation of returns in the equity market with standard deviation of 15.2% over the same time period.
Simply put, leading hedge fund strategies over a measurable time period create higher returns with less potential variation and thus are extremely valuable vehicles. OZM shares with this positive historical track record remain on our Investing Ideas list as a beneficiary of more volatile markets which we see going forward.
RH
In the week following Restoration Hardware's 2Q14 earnings release, the key questions we’re getting from investors focus around the possibility of a revenue ramp in 2H. It’s important to note that we’re looking at an 800 p ramp in ‘deferred revenue’ on the company’s balance sheet, which also synchs with a 35% increase in inventory headed into the third quarter. That’s not to mention a delay in the company’s marketing efforts that should push sales into 3Q.
All in, we’re comfortable with our 24% 3Q top line growth rate, versus the Street at 22%. We remain meaningfully higher for the year.
Let’s also keep this in context with our view that revenue will ramp through 2018 to about $5bn, vs. a sub-$2bn level today. That’s something that should put a 1-2% shift in revenue between quarters into perspective.
* * * * * * * * * *
Click on each title below to unlock the content.
Fund Flows: Trending, Not Mending
Our research shows that despite substantial losses in the U.S. equity fund category over the past 5 months which total $48 billion, the average draw down in U.S. stock funds since 2007 has averaged 40 weeks with over $113 billion lost. In other words, trends could continue on their downward slope.

Are You Positioned Defensively Enough (For Quad #4)?
The slowdown in both growth and inflation domestically requires investors to adopt a particularly defensive asset allocation.

FDX: Moving to Roughly Indifferent
We have ‘liked’ FedEx shares since late 2012, gradually reducing our affinity as the shares have moved higher (although a bit too quickly). With recent gains, we will move to ‘roughly indifferent’.

