Note: Using the z-score in the tables below as a coefficient of variation for standard error helps us flag the relative positioning of the commodities in the CRB Index. It is not intended as a predictive signal for the reversion to trailing twelve month historical averages. For week-end price data, please refer to “Commodities: Weekly Quant” published at the end of the previous week. Feel free to ping us for additional color.
------
1. CFTC Net Futures and Options Positioning CRB Index: The Commodities Futures Trading Commission (CFTC) releases “Commitments of Traders Reports” at 3:30 p.m. Eastern Time on Friday. The release usually includes data from the previous Tuesday (Net Positions as of Tuesday Close), and includes the net positions of “non-commercial” futures and options participants. A “Non-Commercial” market participant is defined as a “large speculator.” We observe the weekly marginal changes in the overall positioning of “non-commercial” futures and options positions to assess the directionally-biased capitulation risk among those with large, speculative positions.
The Sugar, Orange Juice, and Corn markets experienced the most BULLISH relative positioning change in the CRB week-over-week.
The bullish positioning changes in sugar and corn reflect the near-term expectation for prices increases:
- Sugar and Corn have the most bullish expectation for both near-term and longer-term price increases in the CRB Index as measured by the difference between spot prices and longer-dated futures contract prices--> “basis differential” (see below).
- Sugar and Corn prices both lower last week adding to the negative basis spread:
- Corn: -4.2%
- Sugar: -3.2%
The Cotton, Heating Oil, and Copper markets experienced the most BEARISH relative positioning change in the CRB week-over-week:

2. Spot – Second Month Basis Differential: Measures the market expectation for forward looking prices in the near-term.
- The Sugar, Wheat, and Corn markets are positioned for HIGHER PRICES near-term
- The Lean Hogs, Soybeans, and Gasoline markets are positioned for LOWER PRICES near-term

3. Spot – 1 Year Basis Differential: Measures the market expectation for forward-looking prices between spot and the respective contract expiring 1-year later.
- The Sugar, Wheat, and Corn markets are positioned for HIGHER PRICES in 1-year
- The Lean Hogs, Soybeans, and Gasoline markets are positioned for LOWER PRICES in 1-year

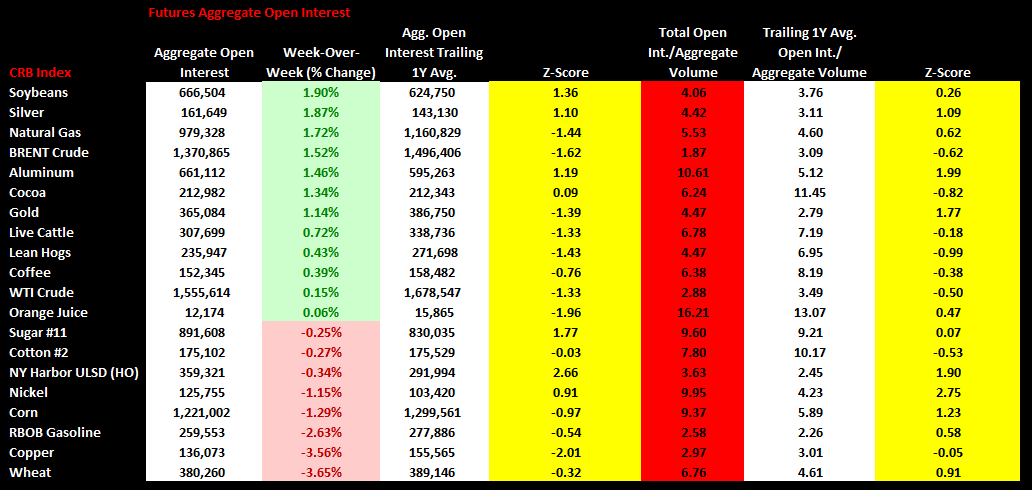
4. Open Interest: Aggregate open interest measures the amount of opened positions in all actively traded futures contract months. Open interest can be thought of as “naked” or “directionally-biased” contracts as opposed to hedgers scalping and providing liquidity. Most of the open interest is created from large speculators or participants who are either: 1) Producers/sellers of the physical commodity hedging their cash market exposure or 2) Large speculators who are directionally-biased on price.
Ben Ryan
Analyst
