Current Best Ideas:

Key Callouts:
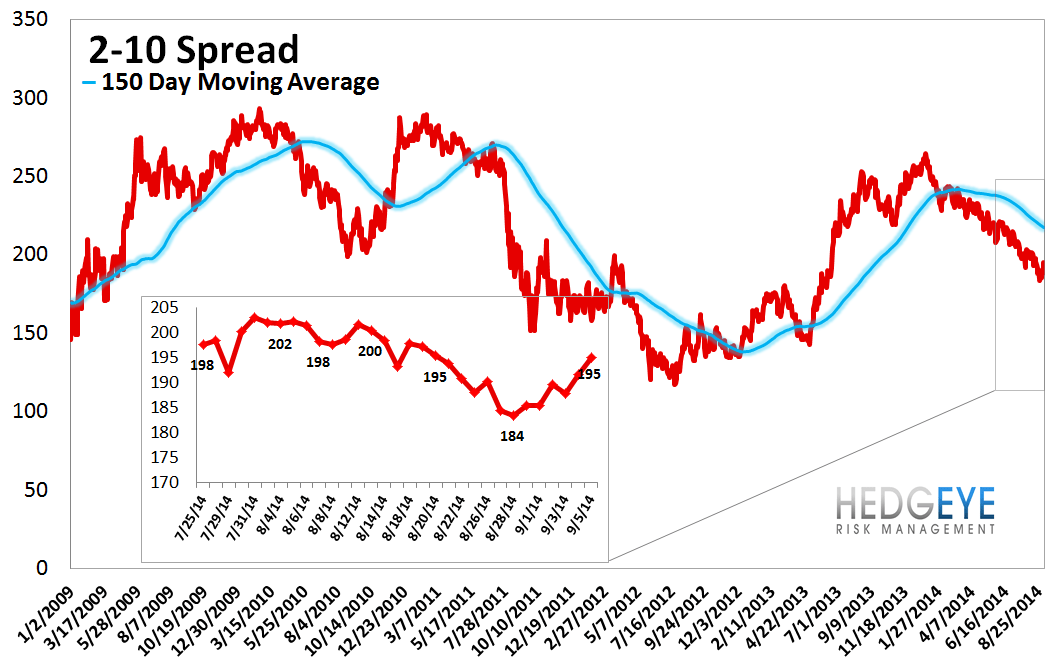
* 2-10 Spread – The long end of the yield curve has been under steady pressure since the start of the year. Last week it caught a bounce, driving the 2-10 spread wider by 10 bps to 195 bps. This doesn't change the longer-term or intermediate-term dynamic we see, especially as rates are down again this morning (10-year treasury yield down 3 bps to 2.43%).
* Chinese Steel – Steel prices in China fell 1.8% last week, or 55 yuan/ton, to 3005 yuan/ton. Prices are down 4.4% on the month and have been in decline since mid-2011. As a reminder, we use Chinese steel rebar prices to gauge Chinese construction activity, and, by extension, the health of the Chinese economy.
Financial Risk Monitor Summary
• Short-term(WoW): Positive / 5 of 12 improved / 3 out of 12 worsened / 4 of 12 unchanged
• Intermediate-term(WoW): Positive / 7 of 12 improved / 2 out of 12 worsened / 3 of 12 unchanged
• Long-term(WoW): Negative / 2 of 12 improved / 3 out of 12 worsened / 7 of 12 unchanged

1. U.S. Financial CDS - Swaps widened for 20 out of 27 domestic financial institutions. The large cap US Financials (money centers, GS, MS) were all wider on the week, though by a nominal 1-2 bps. Specialty Finance companies were also wider, by an average of 4 bps.
Tightened the most WoW: ACE, AIG, UNM
Widened the most WoW: LNC, PRU, GNW
Tightened the most WoW: AIG, MET, ACE
Tightened the least MoM: AON, GNW, AXP

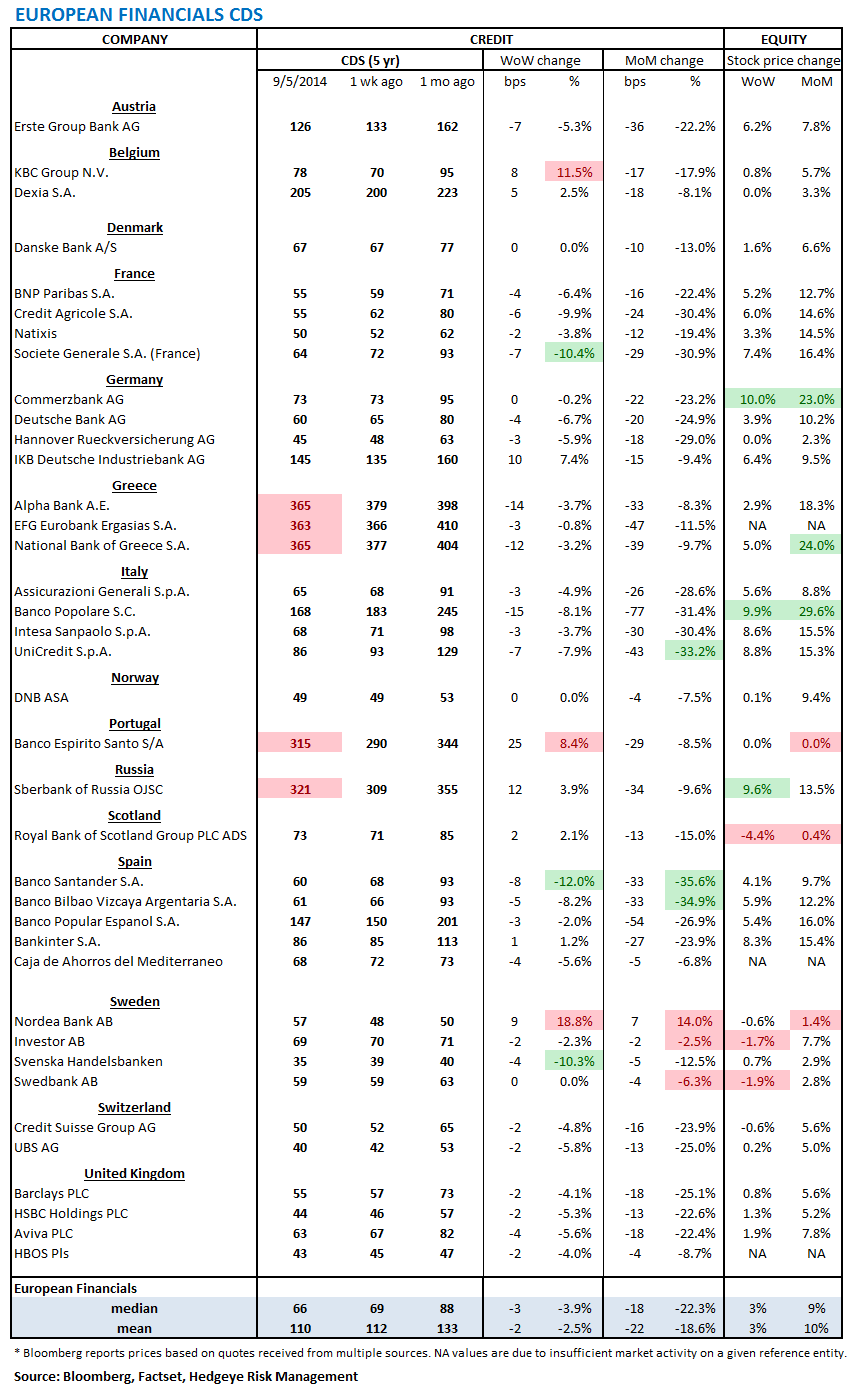
2. European Financial CDS - Swaps were mixed, though, on average, tighter across Europe's banking complex. Apparently, much of the QE-lite move was already priced in. Sberbank widened on the week by 12 bps to 321.
3. Asian Financial CDS - Broad-based tightening in Asian swaps, led by India's banks. Indian banks saw their CDS tighten by an average of 21 bps. Meanwhile, Chinese bank swaps also tightened by an average of 6 bps.

4. Sovereign CDS – Sovereign swaps mostly tightened over last week. The US was the exception, widening by 1 bp to 17 bps. European sovereign swaps were tighter across the board on the heels of the ECB's QE-Lite. Portuguese swaps tightened 17 bps to 145 bps while Spanish sovereign swaps tightened by -10.7% (-7 bps to 57 ).


5. High Yield (YTM) Monitor – High Yield rates rose 8.0 bps last week, ending the week at 5.66% versus 5.58% the prior week.

6. Leveraged Loan Index Monitor – The Leveraged Loan Index rose 1.0 points last week, ending at 1881.

7. TED Spread Monitor – The TED spread fell 0.7 basis points last week, ending the week at 20.4 bps this week versus last week’s print of 21.1 bps.

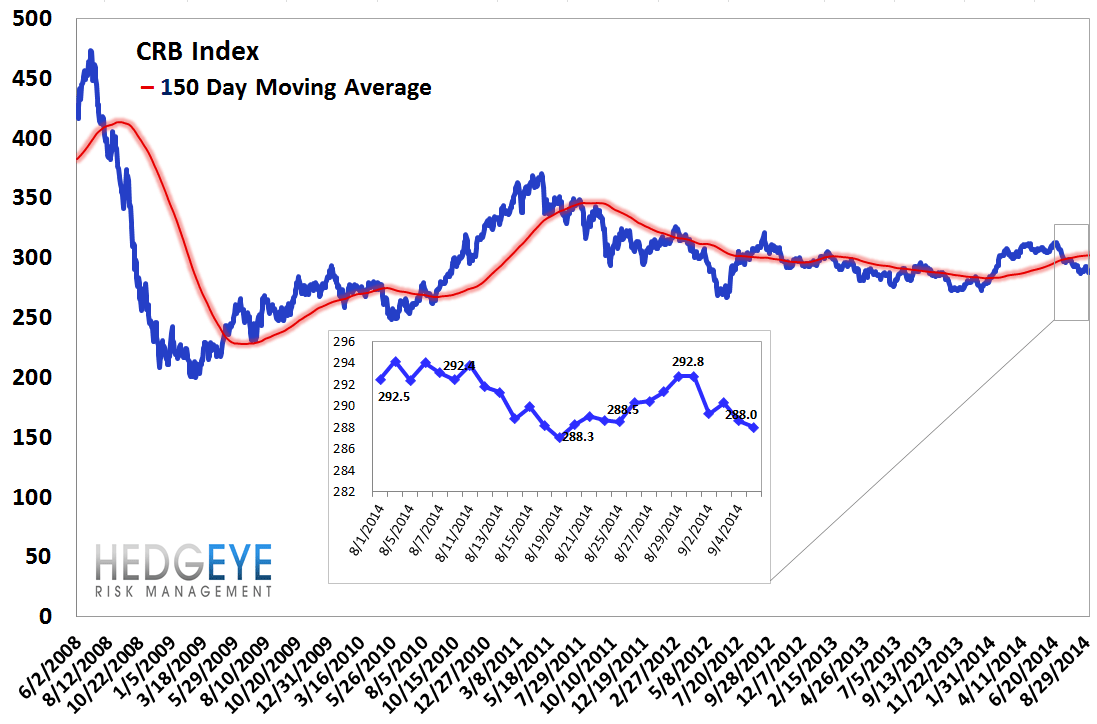
8. CRB Commodity Price Index – The CRB index fell -0.8%, ending the week at 288 versus 290 the prior week. As compared with the prior month, commodity prices have decreased -1.7% We generally regard changes in commodity prices on the margin as having meaningful consumption implications.
9. Euribor-OIS Spread – The Euribor-OIS spread (the difference between the euro interbank lending rate and overnight indexed swaps) measures bank counterparty risk in the Eurozone. The OIS is analogous to the effective Fed Funds rate in the United States. Banks lending at the OIS do not swap principal, so counterparty risk in the OIS is minimal. By contrast, the Euribor rate is the rate offered for unsecured interbank lending. Thus, the spread between the two isolates counterparty risk. The Euribor-OIS spread widened by 1 bps to 17 bps.

10. Chinese Interbank Rate (Shifon Index) – The Shifon Index fell 9 basis points last week, ending the week at 2.82% versus last week’s print of 2.91%. The Shifon Index measures banks’ overnight lending rates to one another, a gauge of systemic stress in the Chinese banking system.

11. Chinese Steel – Steel prices in China fell 1.8% last week, or 55 yuan/ton, to 3005 yuan/ton. We use Chinese steel rebar prices to gauge Chinese construction activity, and, by extension, the health of the Chinese economy.

12. 2-10 Spread – Last week the 2-10 spread widened to 195 bps, 10 bps wider than a week ago. We track the 2-10 spread as an indicator of bank margin pressure.
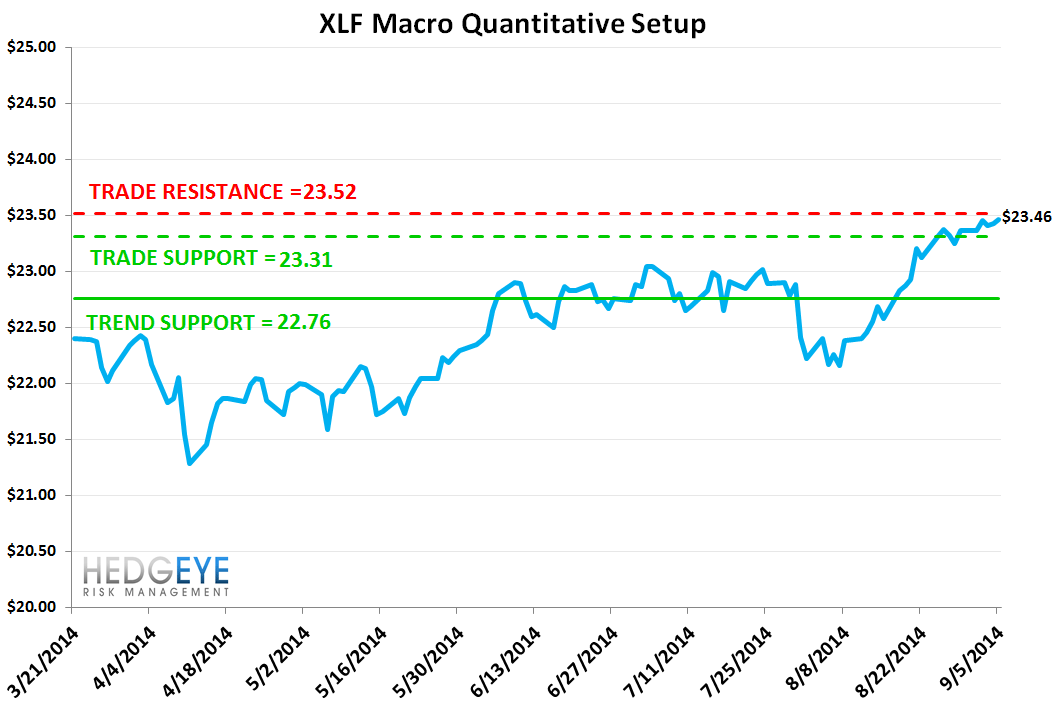
13. XLF Macro Quantitative Setup – Our Macro team’s quantitative setup in the XLF shows 0.3% upside to TRADE resistance and 0.6% downside to TRADE support.
Joshua Steiner, CFA
Jonathan Casteleyn, CFA, CMT
