Our Hedgeye Housing Compendium table (below) aspires to present the state of the housing market in a visually-friendly format that takes about 30 seconds to consume
*Note - to maintain cross-metric comparability, the purchase applications index shown in the table below represents the monthly average as opposed to the most recent weekly data point

Today's Focus: MBA Mortgage Applications
The Mortgage Bankers Association today released its weekly mortgage applications survey data for the week ended August 29th.
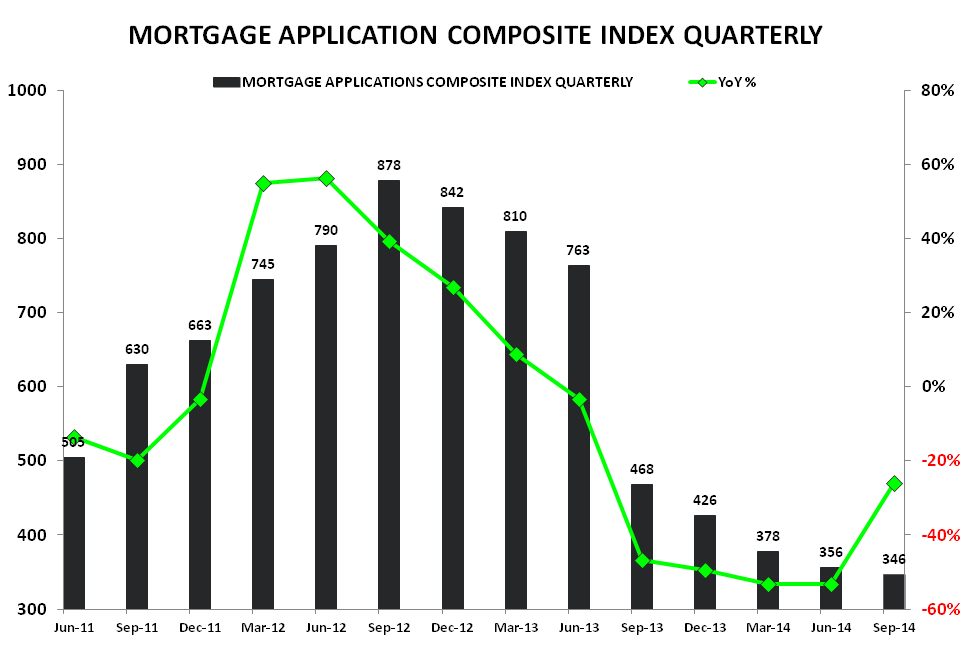
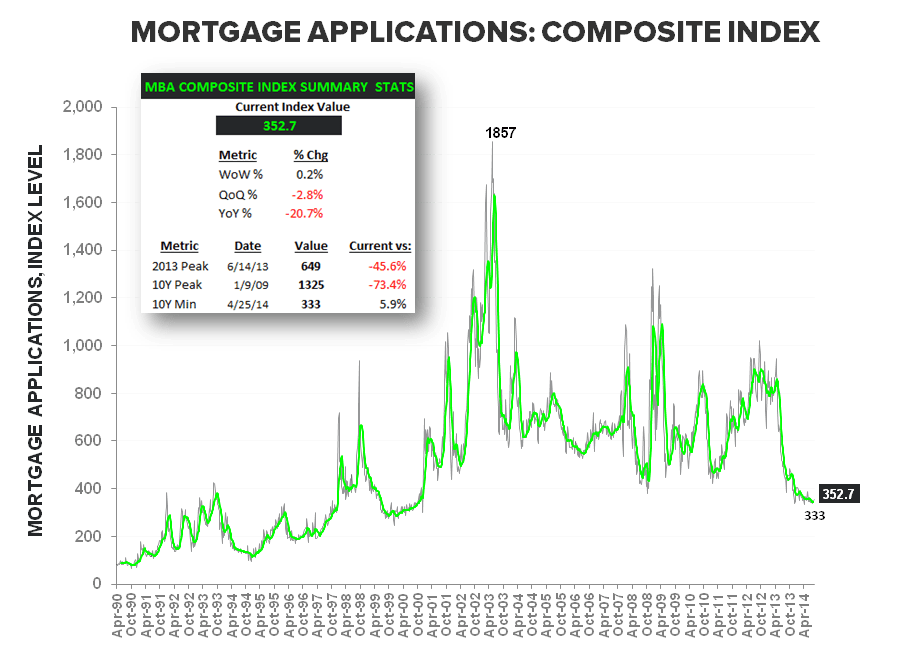
The Composite index managed a +0.2% gain as the YTD low in rates continues to support marginal refi-activity. Purchase demand declined -1.5% sequentilly with the index holding below the 170-level for an eighth straight week as the multi-decade dearth in demand persists to close out August.
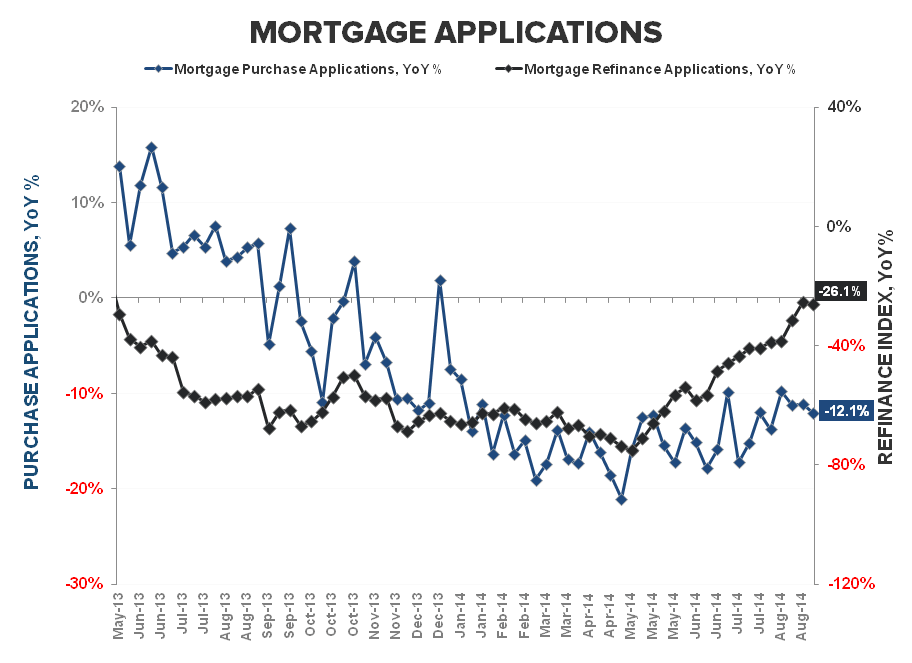
- Demand Anemia, Week 8: The purchase Index fell for the 4th time in 5 weeks, declining -1.5% WoW to 165.8 on the Index. This marks the eighth consecutive week at the 160-level and the softest demand streak since April of 1995. Purchase demand remains down -12% YoY and is currently tracking -6% QoQ.
- Refi & Rates: Refinance activity increased for a 3rd straight week, rising +1.4% sequentially alongside an incremental -3bps decline in the 30Y FRM contract to 4.25%. Rates have declined -10bps over the last month and currently sit at their lowest level YTD. Refi activity remains down -26% YoY but continues to improve as we move through the easiest 2013 comps.
We’ve discussed the regulation-catalyzed shift towards Nonbank origination and the potential challenge to intertemporal reliability and reported demand as measured by the MBA survey. The WSJ and Inside Mortgage Finance (Here) reported that nonbank market share of mortgage originations have increased 6% to 23% in 1H14 vs. 17% in 1H13. While the MBA survey states that it covers 75% of all US retail residential mortgage applications, it does not count applications submitted through the broker/correspondent/wholesale channels.
Under an assumption that the full 6% shift went uncaptured by the MBA survey and allowing for a lower pull-through rate (i.e originations to applications ratio) on non-QM loans, the demand decline moderates but the broader reality of ongoing softness in the housing market remains largely unchanged. From here, demand comps across the MBA Purchase Application and Existing & Pending Home Sales series continue to ease.


About MBA Mortgage Applications:
The Mortgage Bankers’ Association’s mortgage applications index covers more than 75% of mortgage applications originated through retail and consumer direct channels. It does not include loans delivered through wholesale broker and correspondent channels. The MBA mortgage purchase applications index is considered a leading indicator of single-family home sales and construction. Moreover, it is the only housing index that is released on a weekly basis.
Frequency:
The MBA Purchase Apps index is released every Wednesday morning at 7 am EST.
Joshua Steiner, CFA
Christian B. Drake
