Our Hedgeye Housing Compendium table (below) aspires to present the state of the housing market in a visually-friendly format that takes about 30 seconds to consume.

Today's Focus: July/August CoreLogic Home Price Report
CoreLogic released its monthly home price report for July/August earlier this morning. Unlike S&P/Case-Shiller, which is a rolling 3-month average repeat sales index,CoreLogic is a single month index released on almost no lag. Essentially, it gives you information three months more current than what you get from Case-Shiller.
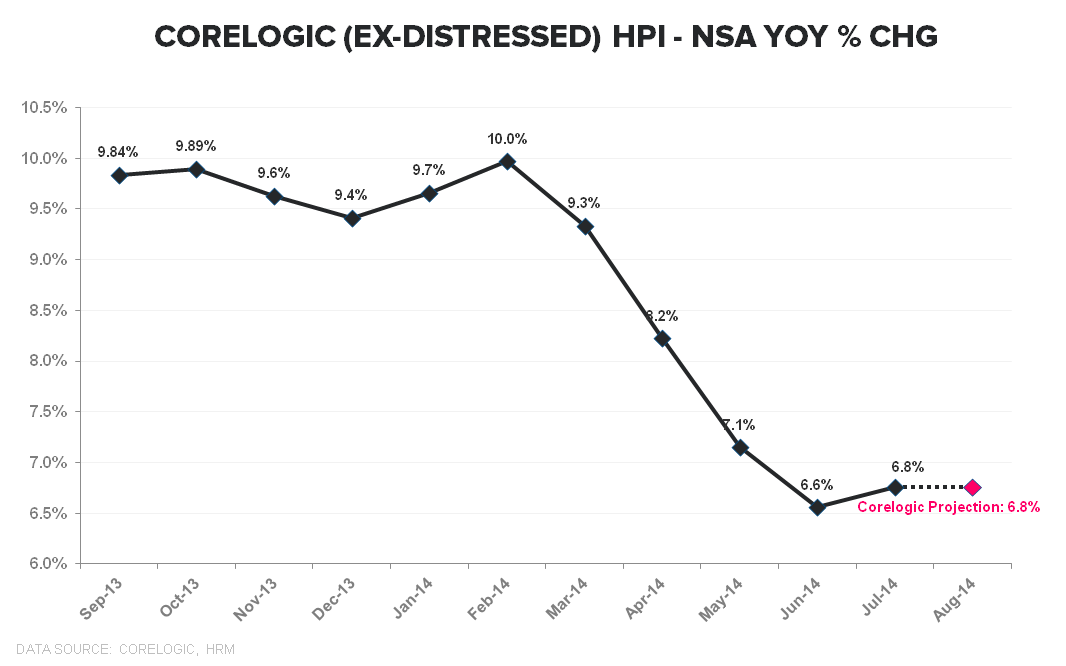
The Data: Home price growth accelerated +10bps to 7.4% in July vs downwardly revised June figures (June revised from +7.5% to +7.3%). The forward looking projection for August estimates a MoM increase of +0.6%, which equates to flat sequential year-over-year growth of +7.3%.
The Dilemma(s):
- Revision to HPI estimate methodology: Back in February, CoreLogic revised the methodology underpinning its month ahead HPI estimate from one based on hard, MLS price data to an econometric model consistent with its intermediate and long-term HPI projections. Subsequent to the February methodology change, the volatility and magnitude of revisions seems to have increased significantly. In short, the forward 1-month estimate has become a less reliable indicator of real-time HPI trends
- June/July – A Tale of Shifting Slope: Last months (June) release was consistent with the post-February HPI deceleration trend with home price growth slowing from 8.3% in May to 7.5% in June to +7.0% in July. However, the estimate revisions in the July release completely shifted the slope in HPI – instead of consistent, ongoing 50-80bps deceleration in the rate of HPI change, the latest release shows a positive inflection in July and the expectation for 3-months of stable growth through August.
The Decision: Its worth re-highlighting our base conceptual framework for housing as its been effective across cycles:
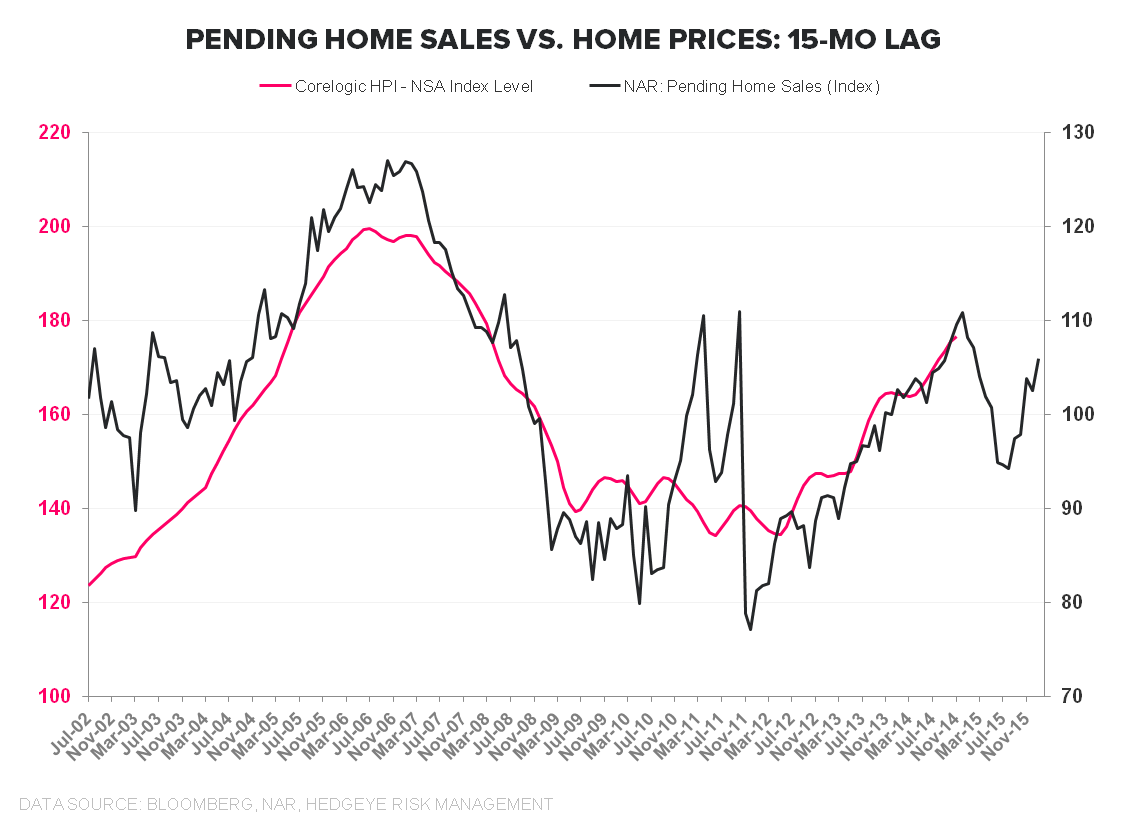
(1) Demand leads HPI (& we know housing demand trends in real-time) ... (2) Home price growth follows the slope of demand on an 12-18mo lag ... (3) housing related equities follow the slope of home price growth
We have anchored on the 2nd derivative move in HPI trends as a key signal because, historically, equity prices across the housing complex have followed the slope in home price growth.
This same dynamic has played out again in 2014 with housing related equities posting negative returns and significantly underperforming alongside the 4 months of discrete deceleration since home price growth peaked in February.
Headfake or Inflection: So, what do we do with a fledgling inflection in home price growth?
Tactically, to the extent the market is discounting zero or low-single digit price growth into 1Q15, a flattening or slowdown in the rate of home price deceleration would be a positive catalyst for housing equities.
The July HPI data is certainly a notable counter-trend shift but with just a single month of data, steepening comps in the back half of the year, and our demand model signaling an imminent peak in HPI, we’re hesitant to pivot on our bearish intermediate term outlook on housing. Bottoms (& tops) are processes, not points, and, at present, we’re content to await confirmatory data.
It's worth noting that while sales comps ease through 2H14, price comps don’t begin to ease until Feb 2015 (hardest near-term comp is Oct which was +11.9% YoY). As such, we think the next 6 months of pricing data will continue weigh on the housing complex.

About CoreLogic:
CoreLogic HPI incorporates more than 30 years worth of repeat sales transactions, representing more than 55 million observations sourced from CoreLogic's property information database. The CoreLogic HPI provides a multi-tier market evaluation based on price, time between sales, property type, loan type (conforming vs. nonconforming), and distressed sales. The CoreLogic HPI is a repeat-sales index that tracks increases and decreases in sales prices for the same homes over time, which provides a more accurate constant-quality view of pricing trends than basing analysis on all home sales. The CoreLogic HPI covers 6,208 ZIP codes (58 percent of total U.S. population), 572 Core Based Statistical Areas (85 percent of total U.S. population) and 1,027 counties (82 percent of total U.S. population) located in all 50 states and the District of Columbia."
Joshua Steiner, CFA
Christian B. Drake