Note: Using the z-score in the tables below as a coefficient of variation for standard error helps us flag the relative positioning of the commodities in the CRB Index. It is not intended as a predictive signal for the reversion to trailing twelve month historical averages. For week-end price data, please refer to “Commodities: Weekly Quant” published at the end of the previous week. Feel free to ping us for additional color.
------
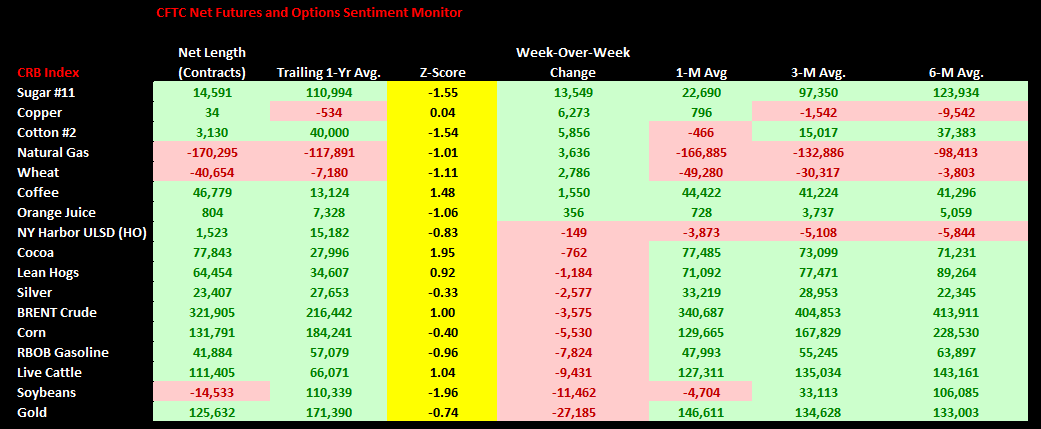
1. CFTC Net Futures and Options Positioning CRB Index: The Commodities Futures Trading Commission (CFTC) releases “Commitments of Traders Reports” at 3:30 p.m. Eastern Time on Friday. The release usually includes data from the previous Tuesday (Net Positions as of Tuesday Close) and includes the net positions of “non-commercial” futures and options participants. A “Non-Commercial” market participant is defined as a “large speculator.” We observe the weekly marginal changes in the overall positioning of “non-commercial” futures and options positions to assess the directionally-biased capitulation risk among those with large, speculative positions.
- The Sugar, Copper, and Coffee markets experienced the most BULLISH relative positioning change in the CRB week-over-week.
Spot Coffee contracts increased +7.8% last week and are currently +3.7% today in New York. We hosted an expert call with Judith Gaines of J. Gaines Consulting on July 21st. A replay and call summary is included via the link below:
Coffee Outlook in 2015 and Beyond
To Judy’s credit, front-month Arabica contracts are +11% since we hosted the call:
- Her thesis is that Brazil, which accounts for more than 1/3rd of global production, is in the middle of a two year- production deficit for the first time ever
- Price estimate for coffee into next year is a relative range of +40-100% from here
- The severity of the crop devastation should be realized by the market near-term (next several weeks) into next spring
- Estimate for aggregate production in Brazil for 2015 is 27M bags vs. 34M from consensus
The CFTC data report shows the market is +5/12/11% longer than its 1/3/6-month averages with the longest overall positioning since March 25th when coffee was previously near YTD highs. The market is net long about 1.7x average 6-month daily trading volume (z-score of +1.5x --> See below).
- The Gold, Soybeans, and RBOB Gas markets experienced the most BEARISH relative positioning change in the CRB week-over-week
Because the CFTC data released on Friday reflects those holders through Tuesday, the change in the positioning of the gold market as reported last Friday reflected the market’s reaction post-Jackson Hole Commentary from the BOJ, ECB, and Federal Reserve two weeks ago:
- Market as a whole took Draghi’s commentary as more dovish than Yellen’s on the margin.
- ECB policy statement will come on Thursday and the market is positioned for a pullback in the Euro out of the meeting:
- Short position in the Euro is -2.6 standard deviations from its trailing 12-month average.
2. Spot – Second Month Basis Differential: Measures the market expectation for forward looking prices in the near-term.
- The sugar, coffee and wheat markets are positioned for HIGHER PRICES near-term
- The lean hogs, soybeans, and live cattle markets expecting LOWER PRICES near-term

3. Spot – 1 Year Basis Differential: Measures the market expectation for forward-looking prices between spot and the respective contract expiring in approximately 1-year.
- The sugar, corn, and wheat markets are positioned for HIGHER PRICES in 1-year
- The lean hogs, live cattle, and soybeans markets are positioned for LOWER PRICES in 1-year

4. Open Interest: Aggregate open interest measures the amount of opened positions in all actively traded futures contract months. Open interest can be thought of as “naked” or “directionally-biased” contracts as opposed to hedgers scalping and providing liquidity. Most of the open interest is created from large speculators or participants who are either: 1) Producers/sellers of the physical commodity hedging their cash market exposure or 2) Large speculators who are directionally-biased on price.

Ben Ryan
Analyst