CHART OF THE DAY: US Personal Savings Rate vs. Asset Price Inflation
08/27/14 08:02AM EDT

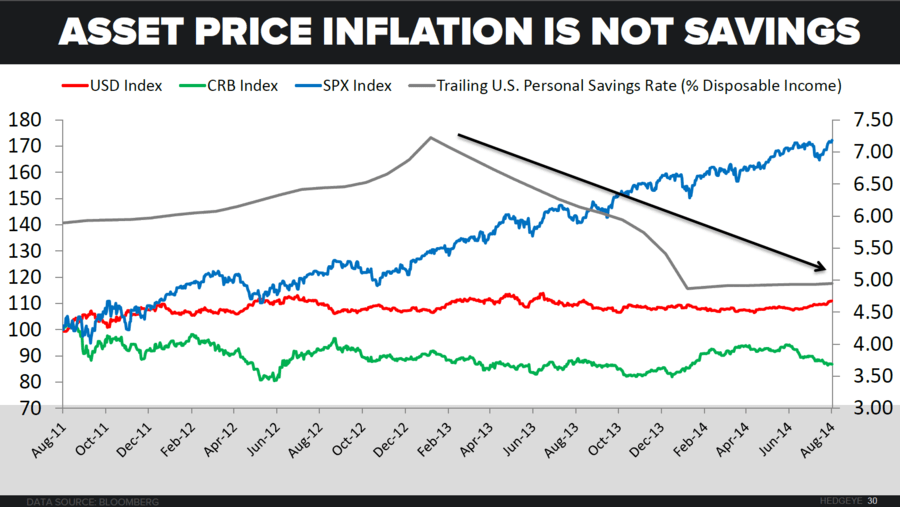
As you can see in the Chart of The Day (pg 30 in our current Macro Themes slide deck – if you’d like a copy, ping sales@Hedgeye.com), the US Personal Savings Rate (% of Disposable Income) has been falling for the past 3 years (as the stock market makes new highs).
© 2025 Hedgeye Risk Management, LLC. The information contained herein is the property of Hedgeye, which reserves all rights thereto. Redistribution of any part of this information is prohibited without the express written consent of Hedgeye. Hedgeye is not responsible for any errors in or omissions to this information, or for any consequences that may result from the use of this information.