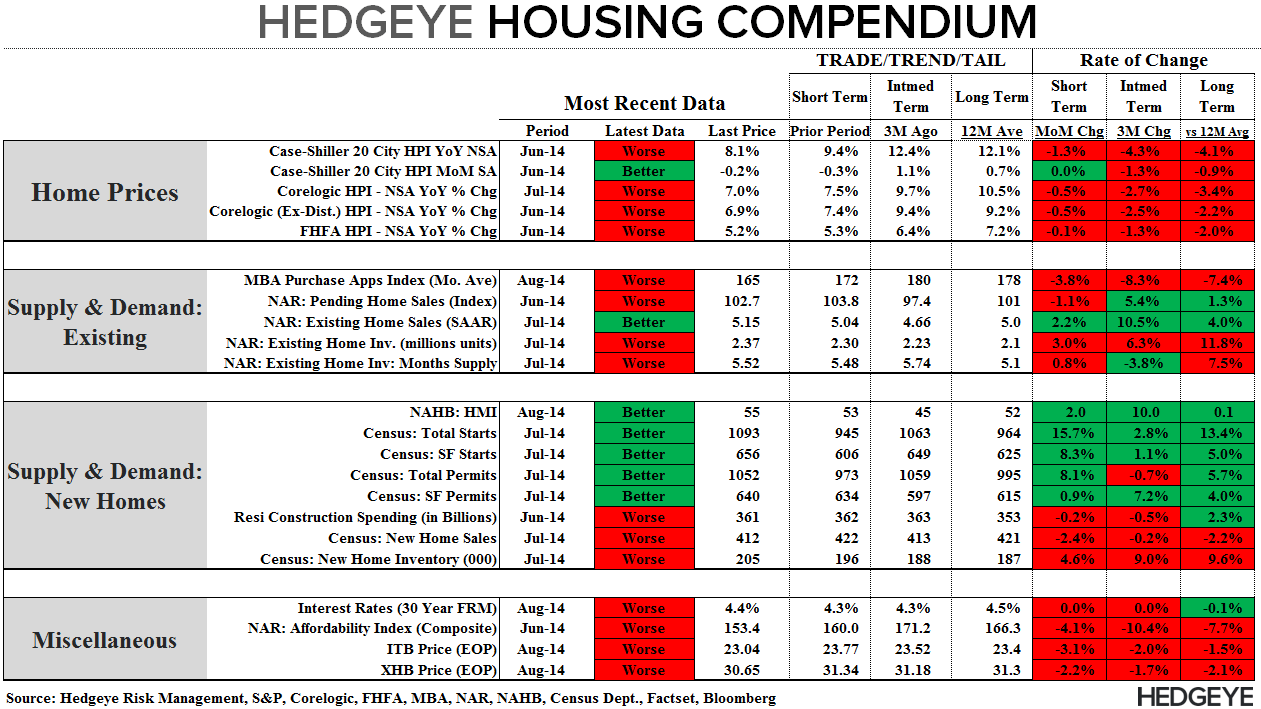
Our Hedgeye Housing Compendium table (below) aspires to present the state of the housing market in a visually-friendly format that takes about 30 seconds to consume.
Today's Focus: June S&P/Case-Shiller Home Price Report & FHFA HPI
Key Takeaways
With July data from Corelogic in hand for almost a month already, we knew the slope and likely magnitude of the deceleration for Case-Shiller in June, but it's nice to get the official confirmation. We should get the Corelogic home price report for August either Monday or Tuesday of next week, which will be the far more important report.
* Home Price growth slowed for a seventh consecutive month, decelerating -130 bps sequentially in June to +8.1% YoY. This was the third biggest month of deceleration since August of 2010 (last month and the month before that were the other two largest months).
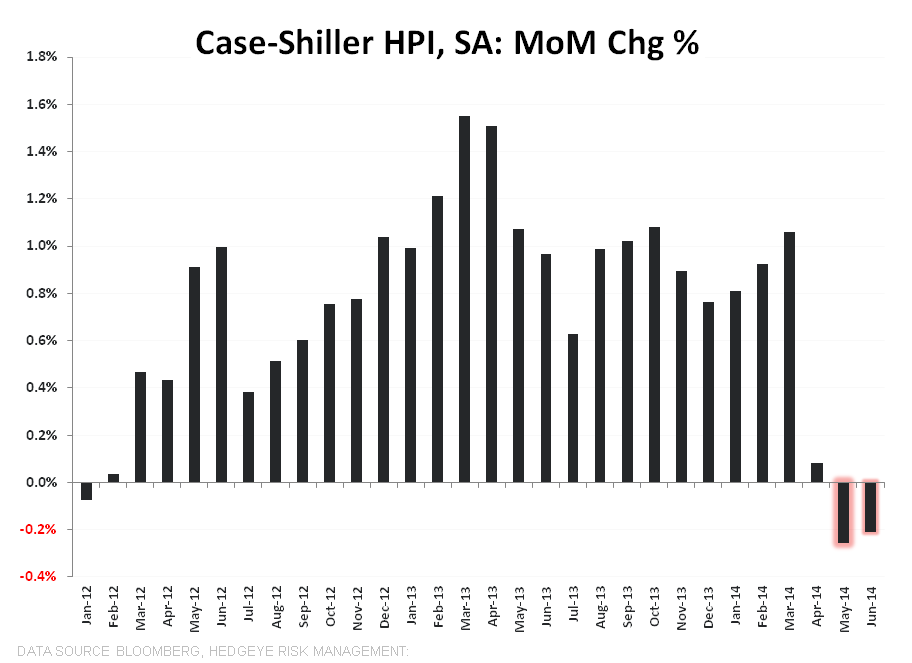
* Notably, June marked the 2nd consecutive month of negative MoM price growth - the first such occurrence since January 2012 in the seasonally-adjusted series.
* As the release aptly highlights, the 2nd derivative slowdown in HPI remains discrete and broad based:
"For the first time since February 2008, all cities showed lower annual rates than the previous month"
So, all the primary price series continue to tell a cohesive story of deceleration – one which we expect to continue through the back half of the year.


Bottom Line:
Housing-related equities follow the path of HPI. So long as HPI is decelerating, housing equities will move sideways to lower. We can forecast HPI's path by looking at demand trends on a 12-18 month lead/lag basis. Our expectation is that prices continue to decelerate throughout 2H14 and potentially into 1H15.
FHFA HPI
The FHFA HPI for June showed home prices decelerated a further -10bps sequentially to +5.2% YoY from 5.3% in May. It's worth noting that the May growth rate was downwardly revised from the previously reported +5.5%.

About Case Shiller:
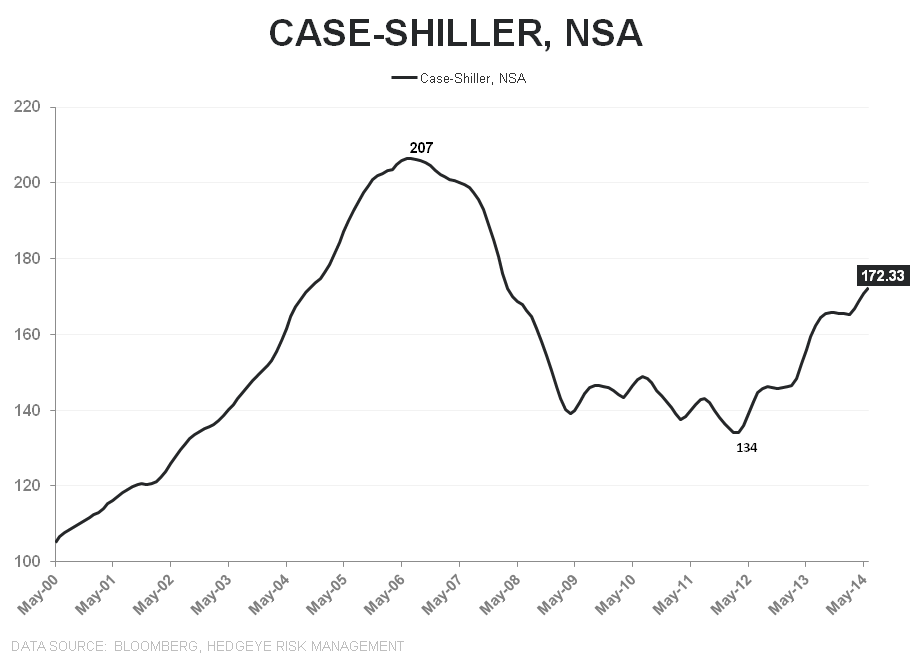
The S&P/Case-Shiller Home Price Index measures the changes in value of residential real estate by tracking single-family home re-sales in 20 metropolitan areas across the US. The index uses purchase price information obtained from county assessor and recorder offices. The Case-Shiller indexes are value-weighted, meaning price trends for more expensive homes have greater influence on estimated price changes than other homes. It is vital to note that the index’s printed number is a 3-month rolling average released on a two month delay.
Frequency and Release Date:
The S&P/Case-Shiller HPI is released on the last Tuesday of every month. The index is on a two month lag and therefore does not reflect the most recent month’s home prices.
Joshua Steiner, CFA
Christian B. Drake
