Our Hedgeye Housing Compendium table (below) aspires to present the state of the housing market in a visually-friendly format that takes about 30 seconds to consume.

Today's Focus: July New Home Sales
New Home Sales declined for a second straight month in July as the new Home market continues to spin its wheels, averaging ~425K +/- 25K each month for the last year. The sales data continues to accord with the middling SF starts and permits figures while remaining at odds with the optimism fueled rise in builder confidence.
Key Takeaways:
* Total: On the heels of the largest sequential decline of the year in June, New Home Sales dropped -10K ( -2.4%) sequentially in July to 412K SAAR. New Home sales represented just 7.4% of total home sales in the latest month, the lowest share percentage since September of last year (see 1st chart below). Existing Home Sales, while lackluster in its own right, continues to dominate the sales recovery as New Home Sales share of total remains depressed vs historic averages.
* Regional: With the exception of the South, all regions saw a sequential decline in sales with growth continuing to run negative on a YoY basis. Notably, the Northeast and South saw a stark divergence in sales trends with MoM and YoY sales growth declining -31% and -44%, respectively in the Northeast and +8% and +33%, respectively, in the South.
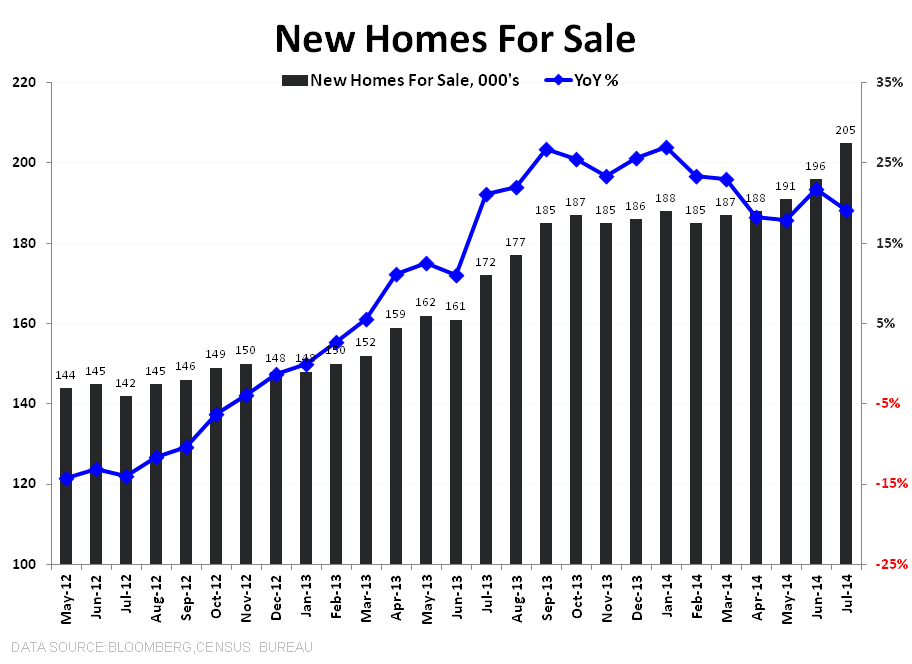
* Inventory: The total inventory of new homes breached the 200K level for the first time since September 2010, rising +4.6% MoM to 205K. Supply continues to trend higher on both a 1Y and 2Y basis.
* Sales vs Sentiment: Rising builder confidence reported in the August NAHB HMI catalyzed the strength in housing stocks to start last week. We’ve highlighted the decoupling of builder confidence, fueled in large part by rising “optimism, from the reality of actual new construction sales the last few months. Absent an inflection in sales trends, it remains more likely than not that builder confidence corrects in favor of the data in the coming month(s).
Bottom Line:
Rising inventory, middling demand and decelerating prices is not a bullish factor cocktail. Comps get easier from here on the demand side of housing but price comps get progressively steeper. We’re considering the stock price implications of an (largely optical) increase in reported volume against easy compares but, as it stands, we’re inclined to maintain our bearish bias until we see the next inflection in the second derivative price trends.


About New Home Sales:
Each month the Census Department releases the New Home Sales report, which measures the number of newly constructed homes that have been sold in the month. The difference between the New Home Sales report and the Starts and Permits report is that New Home Sales only includes single family spec homes built and sold by builders, and does not include condos, apartments, or owner-built units. This is why New Home Sales typically run at roughly half the rate of Starts.
Joshua Steiner, CFA
Christian B. Drake
