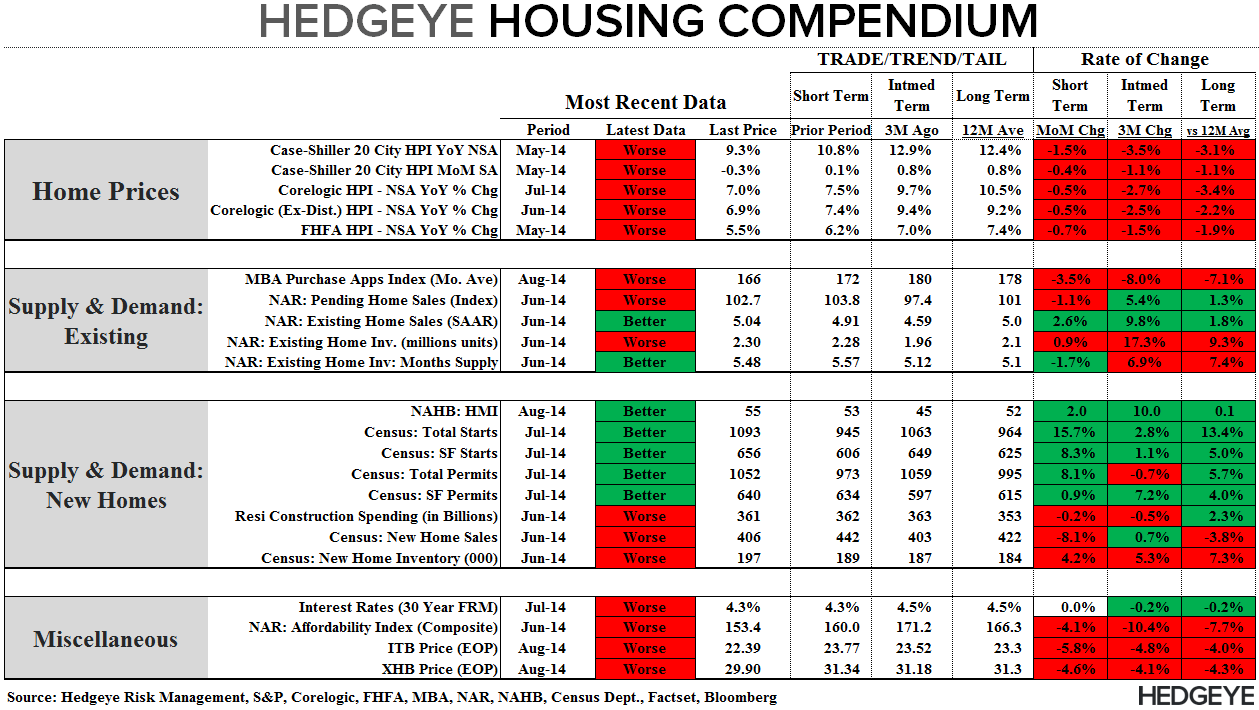
Our Hedgeye Housing Compendium table (below) aspires to present the state of the housing market in a visually-friendly format that takes about 30 seconds to consume.
Today's Focus: July Housing Starts & Permits
The Census Bureau released its monthly Housing Starts & Permits data for July this morning.
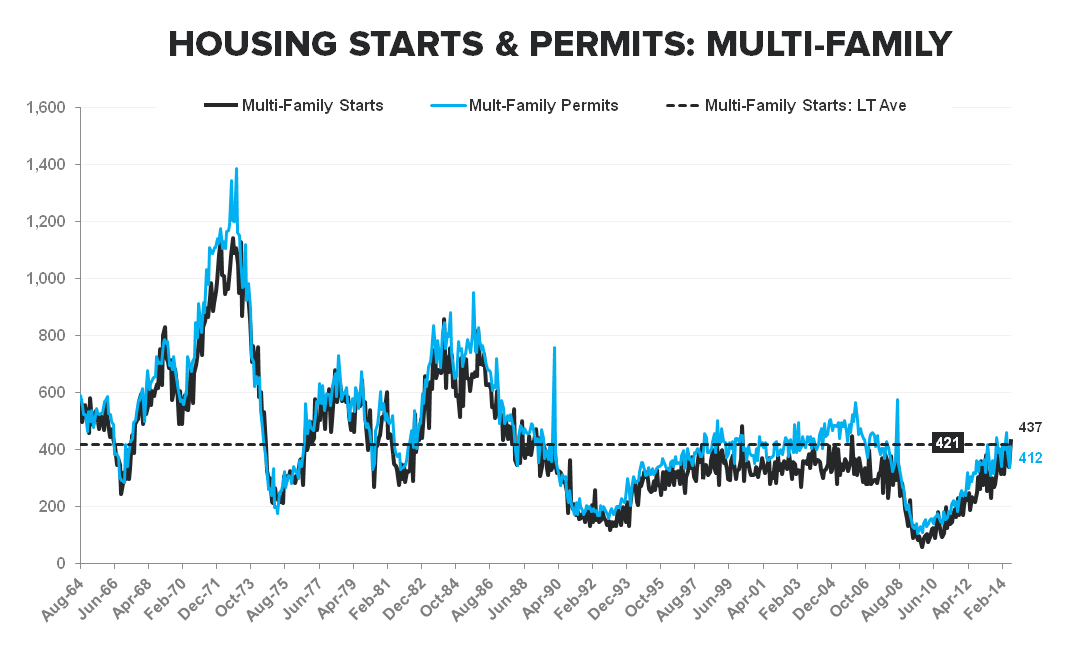
While total starts and permits bounced sharply in July, it was largely a retracement of the cumulative MoM declines recorded in May & June. More importantly, however, the trend in the single family component remains middling and the trend in SF permits, up just +0.9% in July, continues to suggest minimal upside for forward starts. With single-family starts up just +2% YoY on average YTD vs. multi-family up 21%, the concentration in construction activity, and the predominate driver of the recovery in starts, remains well defined.
- Total Starts: Total housing starts re-breached the 1MM level, increasing +15.7% MoM (+148K) to +1093K SAAR with June revised +5.8% to 945K from 893K SAAR. Multi-family, which led the May/June declines, drove the July upside.
- Single Family: SF starts rose +50K MoM (+8.3%) to 656K, the highest level YTD
- Multi Family: MF starts rose +98K MoM (+28.9%) to 437K
- Total Permits: Total Permits rose +79K MoM (+8.1%) to 1052K with the +73K increase in multi-family carrying the increase. The gain in total permits in July, driven principally by multifamily, is suggestive of a decent, MF-heavy print for August starts.
- SF Permits: Single Family permits rose just 0.9% MoM (+6K) to 640K. The trend in permits continues to suggest minimal upside for the forward starts data
- MF Permits: Multi-family permits rose +73K (+21.5%) in July to 412K (after dropping -72K and -51K in May and June, respectively)
NAHB HMI vs SF Starts: Yesterday’s sequential increase in the NAHB HMI accords with the rise in SF starts in July but the burgeoning disconnect between builder confidence (driven by optimism more than sales) and SF construction activity over the last few months remains stark. Moreover – in a further muddling of the crosswalk between the two series – while the Midwest sat as the singular source of strength in the regional builder confidence data, it was the lone source of weakness in the Census data with single-family starts declining -6.8% MoM.
As a reminder, there are three factors principally responsible for the ongoing weak performance for housing. First, QM rules that took effect early this year are having a suppressing effect on credit availability. Second, institutional investor demand for properties is waning sharply. Third, affordability dynamics have swung sharply; whereas 12-18 months ago there was a strong asymmetry favoring homeownership, today renting vs owning are close to a toss-up.


About Housing Starts & Permits:
The US Census Bureau records the number of new housing units that have obtained permits for construction and those that have begun construction. This data includes new buildings intended primarily as residential units. The US Census Bureau defines a start as, “Start of construction occurs when excavation begins for the footings or foundation of a building.”
Joshua Steiner, CFA
Christian B. Drake
