As many of you know, we pay careful attention to the weekly footwear and sports apparel trends from two data service providers (Sportscan and NPD). We recognize that weekly data can be both a blessing and a curse. On one hand, we see trends develop and change with a great degree of frequency, while on the other hand we see the volatility that exists in the “real world” of retailing. Nonetheless, we are often asked the question about the relevancy of the data and if there is any conclusion to be drawn for the publicly traded athletic footwear retailers and manufacturers.
As shown in the chart below, the footwear and apparel data suggests that the industry backdrop was less favorable in Q2 for DKS and sales results may not substantially exceed expectations (as we saw last quarter). At the end of 2008, DKS’ management guided Q109 comps to a range of -9% to -12% and ultimately reported a -6% result. This prompted a change in quarterly and annual guidance from a range of -8% to -12% to a new range of -6% to -9% (the Street is currently expecting a -6.7% comp). Yes the backdrop is getting better on the margin in recent weeks, but the to-be-reported quarter was marked by a sequential deceleration following a post-holiday rebound.
A little more detail on our analysis. It is important to note that Dick’s does not report their weekly sales to the two data providers that we use. However, given geographic, product, and pricing trends represented in the sample set, there is value in the comparison. The bottom line is, quarterly sports apparel and athletic footwear trends have a strong historical correlation with DKS’ reported same store sales. Based on our analysis, the correlation between a weighted average of apparel/footwear trends and DKS’ historical same store sales is 80%. To arrive at this conclusion, we aggregated our weekly data sets in order to properly align DKS’ fiscal quarters with the corresponding Sportscan/NPD information.
Ultimately, we can’t claim 100% accuracy in the predictability of using the weekly trends to forecast DKS same store sales for any given quarter. However, marrying the data with historical sales results shows directional changes and inflection points with a high degree of accuracy. Based on Sportscan and NPD alone, we see that Q209 trended down measurably from Q109. Again, this suggests 2Q results could be weaker than the slight deceleration expected by the Street. On the other hand since June, it appears that sporting apparel sales are holding even, while athletic footwear is showing a slight uptick. Consistent with many other retailers and recent weekly data, we expect commentary on back to school to be incrementally positive.

Note: DKS quarterly comp trends correlate most with a blended footwear-apparel data set. The blend is comprised of a two-thirds weighting in sports apparel from Sportscan and one-third footwear data from NPD. The blended data set is designed to best represent Dick’s product mix in these categories, with the obvious limitation of not representing any hard goods in the analysis (hard goods represent 54% of DKS total sales).
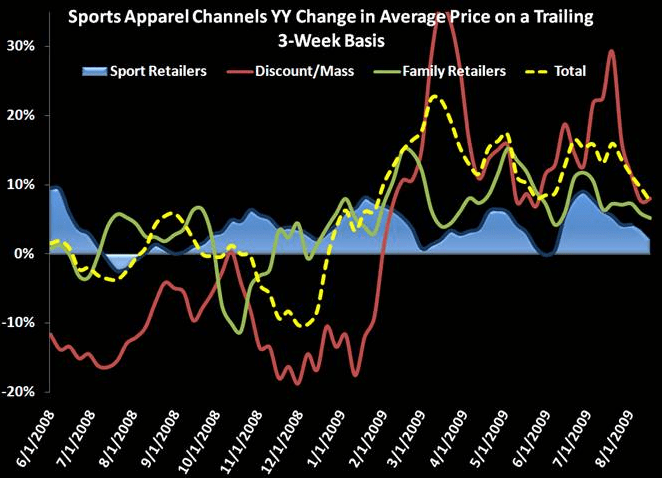
Weekly Sports Apparel Update
Sports Apparel posted a positive week in the thick of the back to school season, with strength in the Full Line Sporting Goods (increased 12.1%) and Family Footwear channels (up 29.2%). All channels experienced a sequential improvement in total sales growth. Average selling prices remained relatively stable while there were some signs of sequential deceleration in ASP growth. In general, the environment does not appear to be overly promotional or aggressive. Sport Retailers have been easing into the 2009 BTS season with incrementally slower ASP growth for the last 5 weeks, culminating with essentially flat ASP’s this week. Geographically, the South Central and South Atlantic showed the biggest change in sales trends, helping to drive the total sports apparel category back into positive territory. New England and the Mid-Atlantic (both later back to school markets) showed the weakest trends for the period.