TREND Support: 3.17
TAIL Line: 3.19 (Previous resistance level and critical breakout line)
Copper ripped +1.8% Thursday after a big manufacturing PMI beat and sold off -83bps on Friday to finish the week +1.7% (up another +12bps today). We added it (ETF: JJC) to real-time alerts on 7/18 and booked the gain on an oversold signal last Friday.
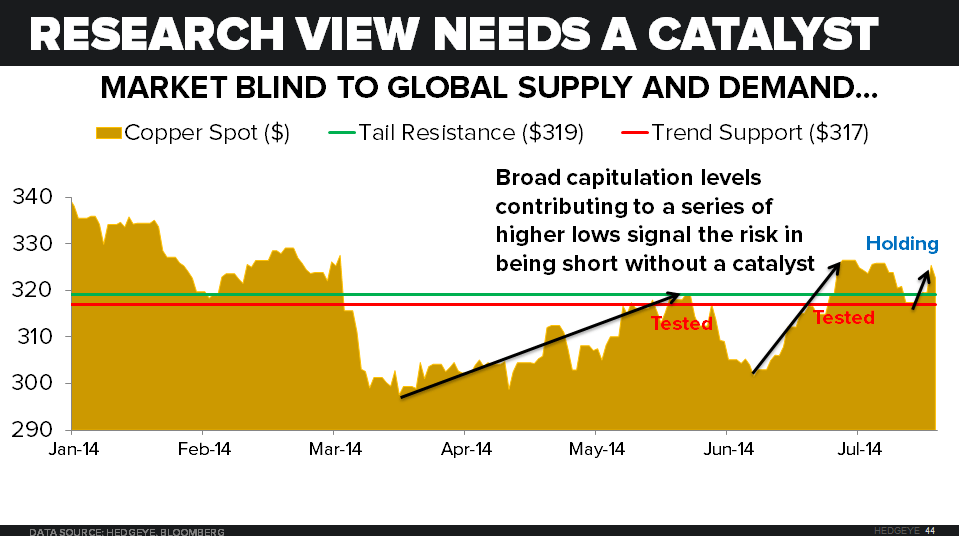
On the move, copper broke out above its previous $3.13 intermediate-term TREND line of resistance last week and remains above its long-term TAIL Line (Refreshed TREND support now at $3.17).
Consensus macro leans on the strength of the Chinese economy as a leading indicator for base metal demand (as it should). China consumes over 40% of the world’s industrial metals (up from 5% in 1980).
2013 Consumption (% global demand):
- Nickel: 47.4%
- Aluminum: 46.1%
- Zinc: 45.6%
- Copper: 42.4%
An equally weighted index of Chinese GDP and industrial production to industrial metals prices (CRB metals index) is running an r-squared of 0.50 currently, down from a December 2011 peak. Although diverging from the 2011 highs, the relationship cannot be ignored as a market catalyst.
I have read the supporting research around the following data points from fundamentally focused sell-side research teams. Most of it supports the argument for the unsustainability, and thus bearish pressure, on Chinese base metal demand:
- Copper and aluminum consumption has increased six-fold since 1999
- China is 3x the size of the United States and, since 2011, base metal demand per capita is trending higher than the United States.
- China’s consumption to investment ratio (consumer demand/cap-ex ) is at historical highs:
- China: 0.7x
- USA: 3.5x
- UK: 4.6x
- Eurozone: 3.3x
- Chinese credit growth has manifest at incredibly rapid rates:
- Aggregate debt level has reached 251% of GDP as of June which is a 20% increase from late 2013.
Note: The commodity-collateralization fueling this rapid increase in credit growth has been continuously highlighted as a bubble in base metal markets. Speculation as to how much commodity-backed financing has contributed to credit growth, along with an investigation into the Qingdao Port warehouse has continuously been labeled a catalyst for volatility in base metal prices. With the opaqueness in obtaining information as to whether multiple parties within the Chinese financial system have used the same metal stockpiles as collateral to access otherwise unavailable credit markets, we choose to focus on the observable. Goldman estimates that $160Bn has flowed into China through commodity-backed loans since 2010. Regardless, the argument that this scandal has helped fuel an unsustainable credit boom has been labeled a bearish signal for base metals.
- Debt/GDP levels have increased 100% over the last five years
- China’s $26 trillion of debt is more than the entire commercial banking system of the U.S. and Japan combined
- On the supply side, an increase in late cycle mining cap-ex flooding the market requires an unsustainable amount of consumption from China

Although we must always look to reported numbers from China with caution, it’s difficult for me to make a fundamental case to buy copper more long-term.
Most of the sell-side research we have consumed points to the unlikelihood of a Chinese economy capable sustaining a rapid increase in base metal consumption. The statistics above may appear staggering, but without a contextual overlay and a market catalyst they fail to provide enough conviction for us to marry the story. Risk moves quickly, and we need to know that the market believes a research call before we would get in front of it. So far, this inflection point has not happened as reflected in base metal prices, especially in copper.
We continue to field mixed economic data out of China, but both the fundamental and quantitative picture turned more bullish late last week. For additional color, click on the link below to access the note:
Should You Chase the Rally in Chinese Equities?
On one hand the Chinese property market remains a disaster…
- JUN E-House Home Price Index (288 cities): 5.3% YoY from 5.8% prior
- Prices of new homes in 288 cities fell -0.1% MoM in JUN, the third sequential decline in a row
- JUN China Real Estate System Index (CREIS) Home Price Index (100 cities): 6.5% YoY from 7.8% prior
- Average prices in the 100 biggest cities fell -0.5% MoM, the second consecutive sequential decline

With both housing prices and overall construction sequentially decelerating, the outlook for slowing demand of raw materials seems probable.
On the flip side of the coin, after digging into the various forms of stimulus out of local and municipal stimulus, we believe the Chinese government is directly targeting what has been a deteriorating real estate market with its recent stimulus measures which have proven a bullish catalyst for Chinese equities (and base metals):
Excerpt from the above note:
“But perhaps the real reason Chinese policymakers were content to ease monetary and fiscal policy of late was to shore up the country’s crashing property market.
Along those lines, many local governments have taken matters into their own hands by easing home purchase restrictions (27 of 46 cities did so yesterday). Moreover, last week’s statement out of the Ministry of Housing and Urban-Rural Development (MOHURD) would seem to suggest that such easing in property markets at the local level have the official blessing of Beijing as well”.
For now the flow-through from an unconventional mix of stimulus has proven more positive for the slope of Chinese growth than we previously expected. The easing-induced credit growth and positive manufacturing data support trading China with a bullish bias for now.
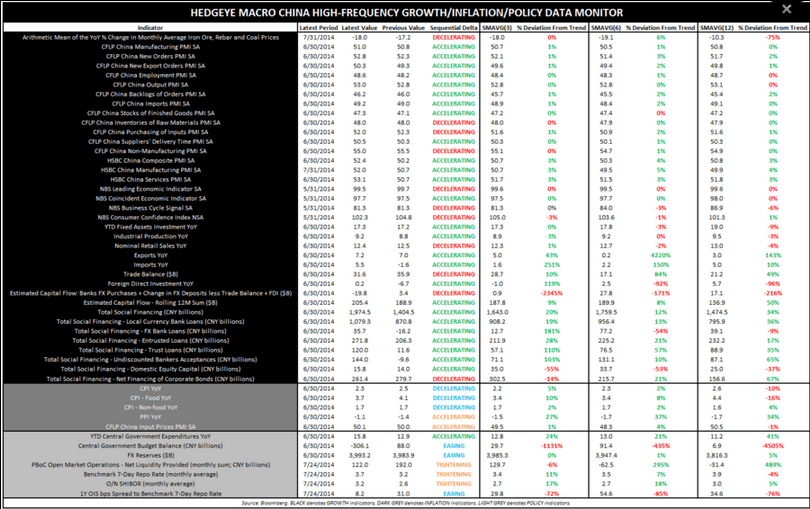
The correlation between base metal prices and Chinese economic data remains intact. Because we have no other incentive other than to be on the correct side of inflection points across the globe, we absorb the data, and watch the market’s reaction:
- HSBC Mfg. PMI: 52.0 July vs. 50.7 expected (huge blow-out).
- Front-Month copper rips to the upside:1.84%.
- We rode this move for a gain in real-time alerts (ETF: JJC) before selling Friday morning as the move was exhausted to the upside.
If my macro teammates asked my opinion as to whether or not we should go acquire some physical copper and throw it in a warehouse, I would have a tough time passing along a vote of confidence. We absorb, organize, and analyze a slew of economic and behavioral market data on a daily basis, and must be willing to change our opinion if it’ll put us in an alpha-generating position. For those of us who are price-sensitive near-term on both the entry and exit points, we have a few options in the commodity space: futures, derivatives, and ETFs.
Studying the volume, volatility, and critical capitulation levels of the market as a whole provides insight into the behavioral conviction behind a move. Enjoy the electronic trading or not humans and machines have levels, and a sharp directional move eventually becomes exhausted. At Hedgeye, we refer to these short-term TRADE exhaustion levels as OVERBOUGHT and OVERSOLD.
When we then utilize these levels (think of directional moves from a standard error perspective) with a directional bias from an intermediate-term TREND standpoint, the absolute price movements become second derivative changes. Therefore, absolute measures of risk may seem underpriced when multiple durations are observed (which is why we plot and model our perception of risk relative to the markets on multiple durations).
If copper is making a series of higher lows from a TREND perspective (critical observed capitulation levels moving higher) on aggregate futures volume (last Wednesday prior to the HSBC Mfg. PMI print) that is:
~35% below 1,3, and 6-month volume…
with
Volatility being sold for -3%,-10%, and -16% below 1, 3, and 6-month averages….
Shorting copper on a Chinese supply and demand call for physical copper is a risky position without a catalyst.
Open interest (Open, and un-closed positions both long and short) in the spot market for copper was just 2.3% of average daily trailing 6-month trading volume.
Because the front-month is now illiquid, those holding positions are probably stuck with a position, or intending to transact in physical copper. With so much speculation in commodity markets from both man and machine, a directional confirmation in observed trading activity remains the most important catalyst that must agree with a fundamental call. Feel free to ping us with any questions.
Ben Ryan
Analyst