INVESTMENT IDEAS
The table below lists our current investment ideas as well as a list of potential ideas we are in the process of evaluating (watch list). We intend to update this table regularly and will provide detail on any material changes.

EVENTS THIS WEEK
7/28/14 TSN Earnings Call 8am EST
7/29/14 RAI Earnings Call 9am EST
7/29/14 HLF Earnings Call 11am EST
7/30/14 SODA Earnings Call 8:30am EST
7/30/14 REV Earnings Call 9:30am EST
7/30/14 ENR Earnings Call 10am EST
7/30/14 KRFT Earnings Call 5pm EST
7/30/14 SAM Earnings Call 5pm EST
7/31/14 NWL Earnings Call 8am EST
7/31/14 AVP Earnings Call 9am EST
7/31/14 K Earnings Call 9:30am EST
7/31/14 CL Earnings Call 11am EST
8/1/14 PG Earnings Call 8:30am EST
8/1/14 CHD Earnings Call 10am EST
8/1/14 CLX Earnings Call 1:15pm EST
WEEK-OVER-WEEK PERFORMANCE
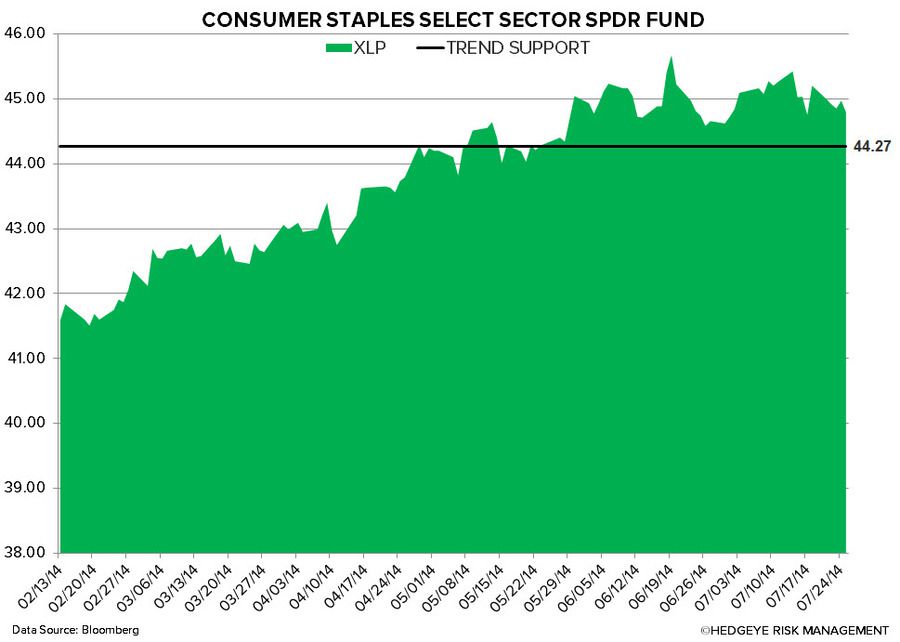
Consumer Staples fell -0.9% week-over-week versus the broader market (S&P500) flat. XLP is up 4.2% year-to-date versus the SPX at 7.0%.
Positive Divergence: HLF 8.6%; SODA 7.1%; DPS 3.5%; HAIN 3.1%; MJN 2.2%
Negative Divergence: TUP -11.6%; DF -8.0%; KMB -4.2%; RAI -3.1%; CLX -3.0%
RECENT NOTES
- HSY – Beware C-Store and Commodity Headwinds in 2H
- MO – Price Taking Negates Steep Volume Declines
- Just Charts – Kicking Off Earnings Season
From a quantitative set-up XLP broke its immediate term TRADE duration last week and is now bearish, while the intermediate term TREND duration remains bullish.
The Hedgeye U.S. Consumption Model shows 7 of the 12 U.S. Economic Indicators flashing green.

Despite the bullish quantitative set-up for the sector, we continue to believe that the group is facing numerous headwinds, including:
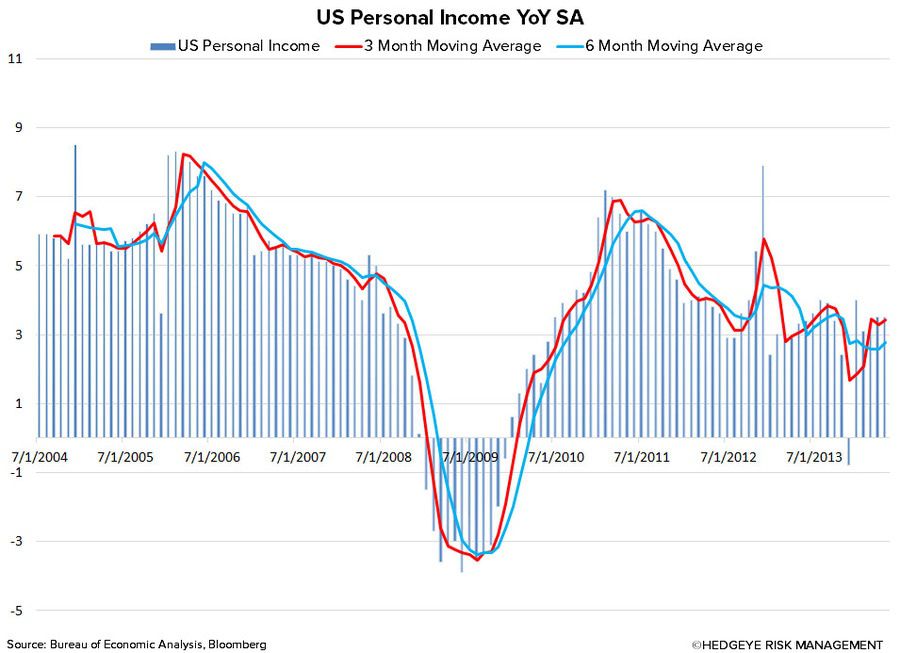
- U.S. consumption growth is slowing as inflation rises, in-line with the Macro team’s 1Q14 theme of #InflationAccelerating, Q2 2014 theme of #ConsumerSlowing, and Q3 2014 theme of #Q3 Slowing
- The economies and currencies of the emerging market – once the sector’s greatest growth engine – remain weak with the prospect of higher inflation in 2014 eroding real growth
- The sector is loaded with a premium valuation (P/E of 19.3x)
- Less sector Yield Chasing as Fed continues its tapering program
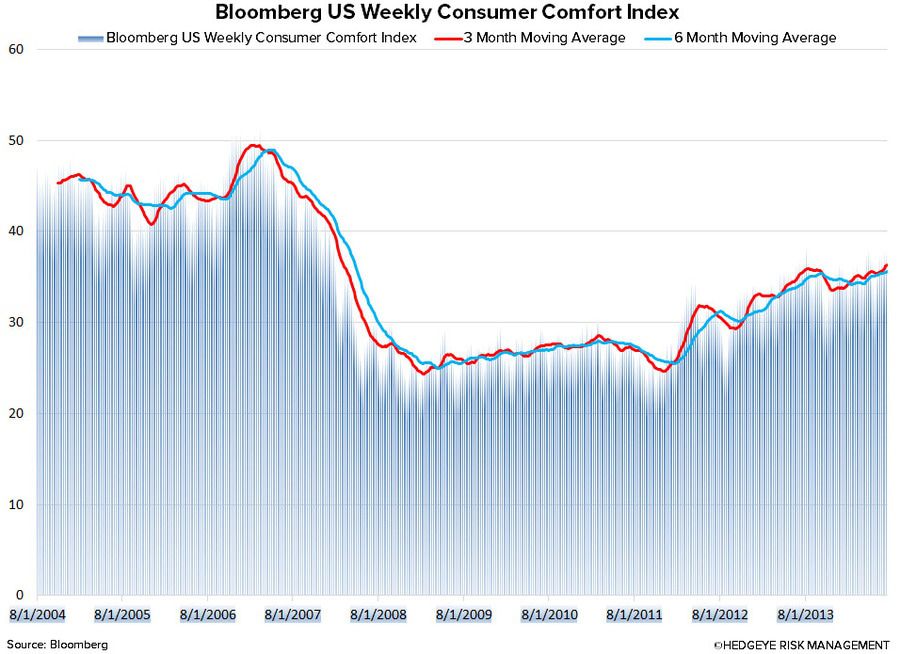
- The high frequency Bloomberg weekly U.S. Consumer Comfort Index (rescaled for cosmetic and not component reasons) has not seen any real improvement over the past 6 months, but rose to 37.6 versus 37.5 in the prior week

QUANTITATIVE SETUP
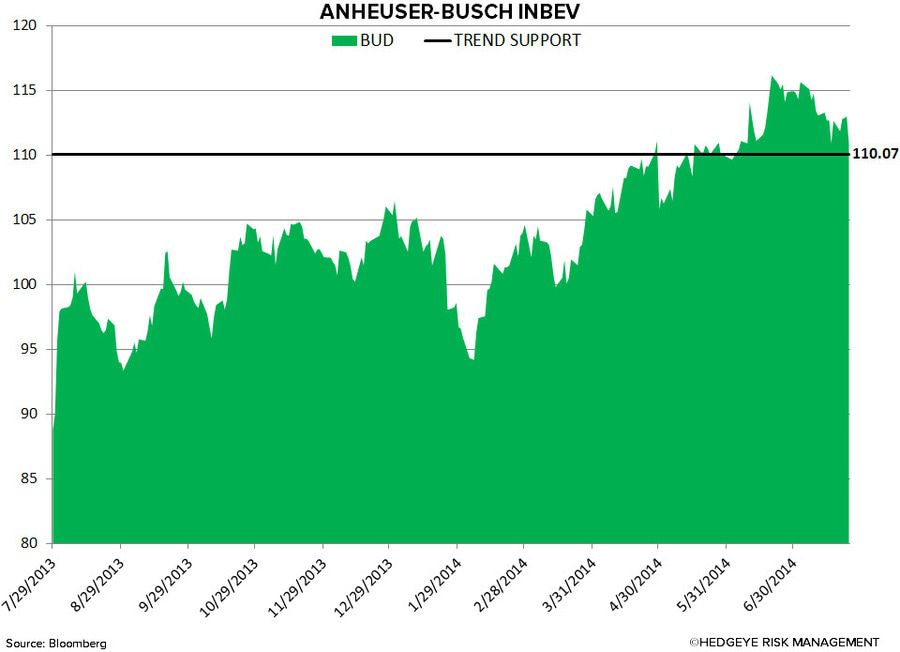
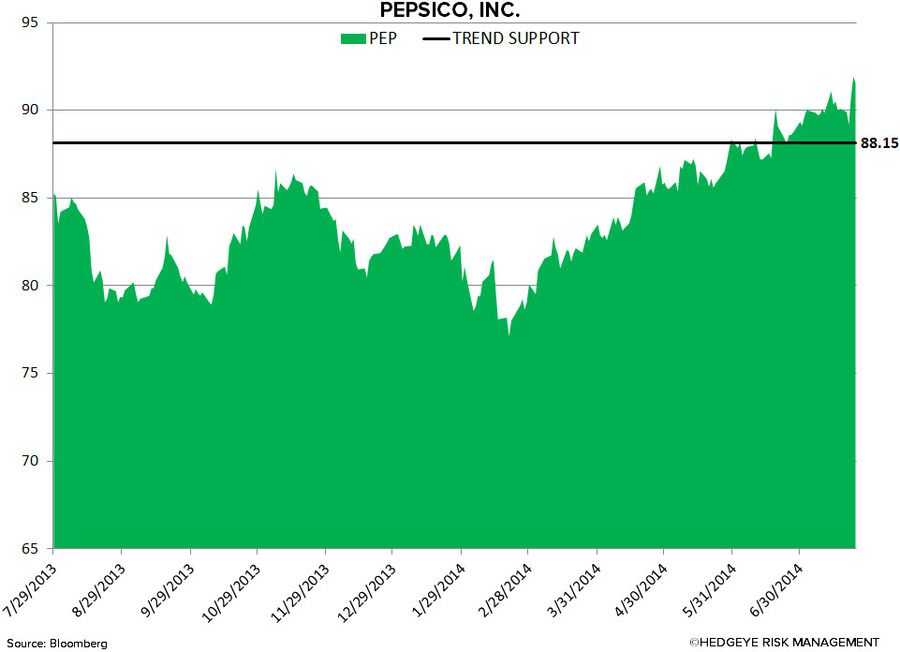
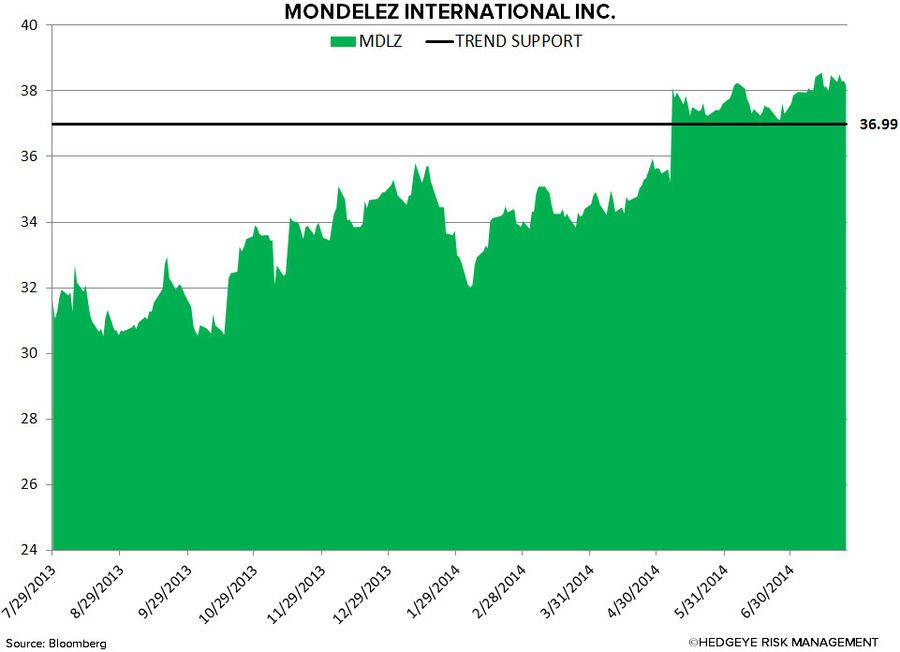
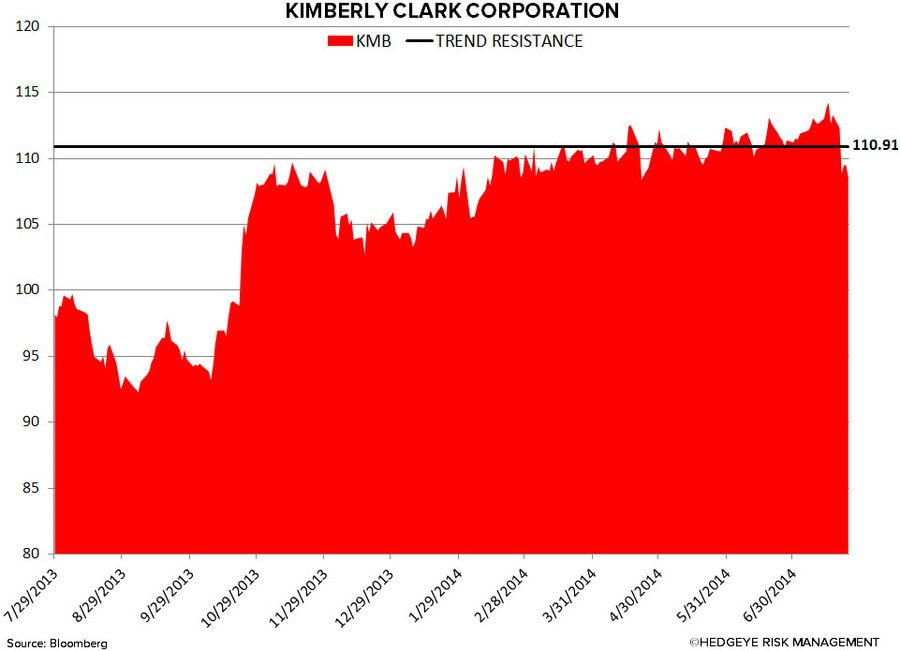
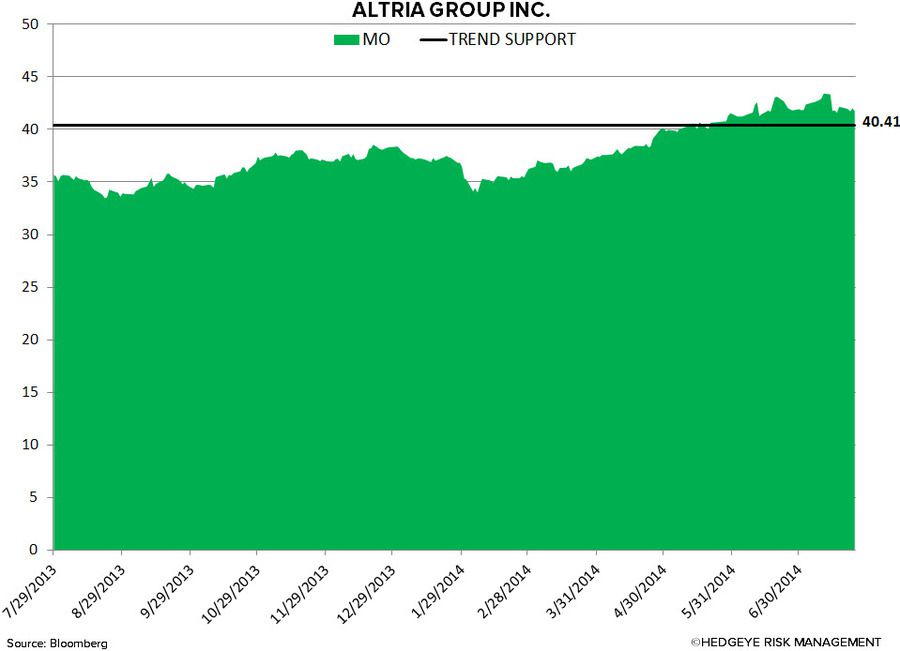
In the charts below we look at the largest companies by market cap in the Consumer Staples space from a quantitative perspective.
BUD – bullish TREND support = 110.07
DEO – bearish TREND resistance = 126.32

KO – bullish TREND support = 40.88

PEP – bullish TREND support = 88.15
GIS – bullish TREND support = 52.44

MDLZ – bullish TREND support = 36.99
KMB – bearish TREND resistance = 110.91
PG – bearish TREND resistance = 80.31

MO – bullish TREND support = 40.41
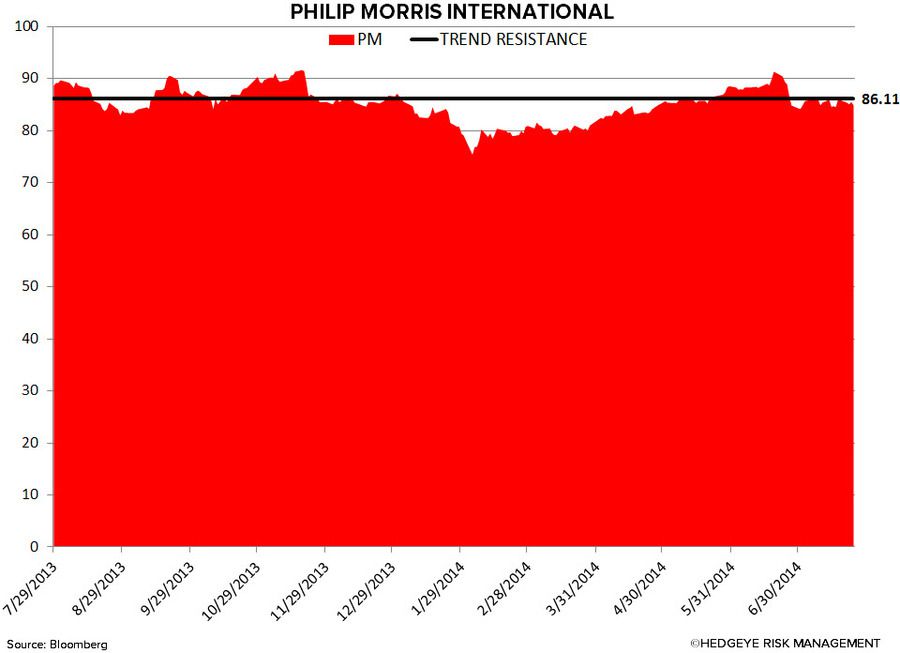
PM – bearish TREND resistance = 86.11
Howard Penney
Managing Director
Matt Hedrick
Associate
Fred Masotta
Analyst
