Crisis: Risk & Opportunity
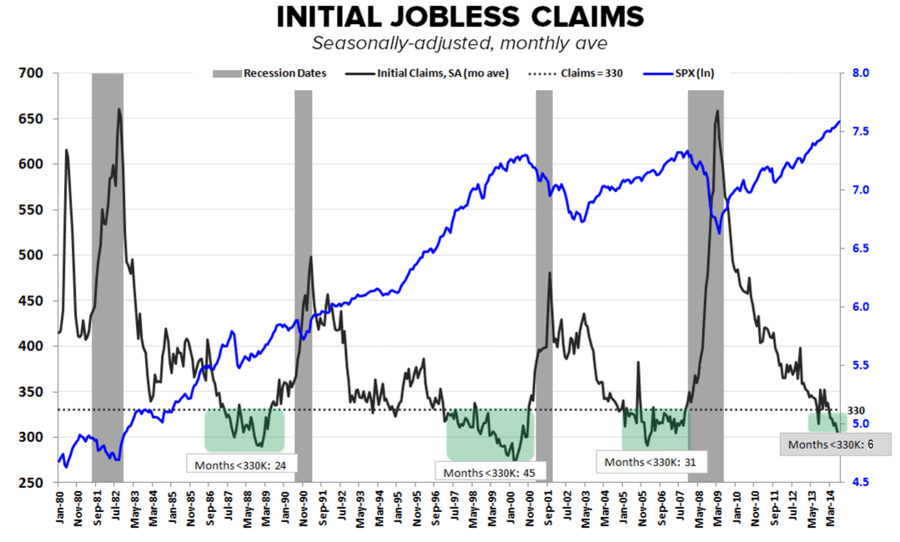
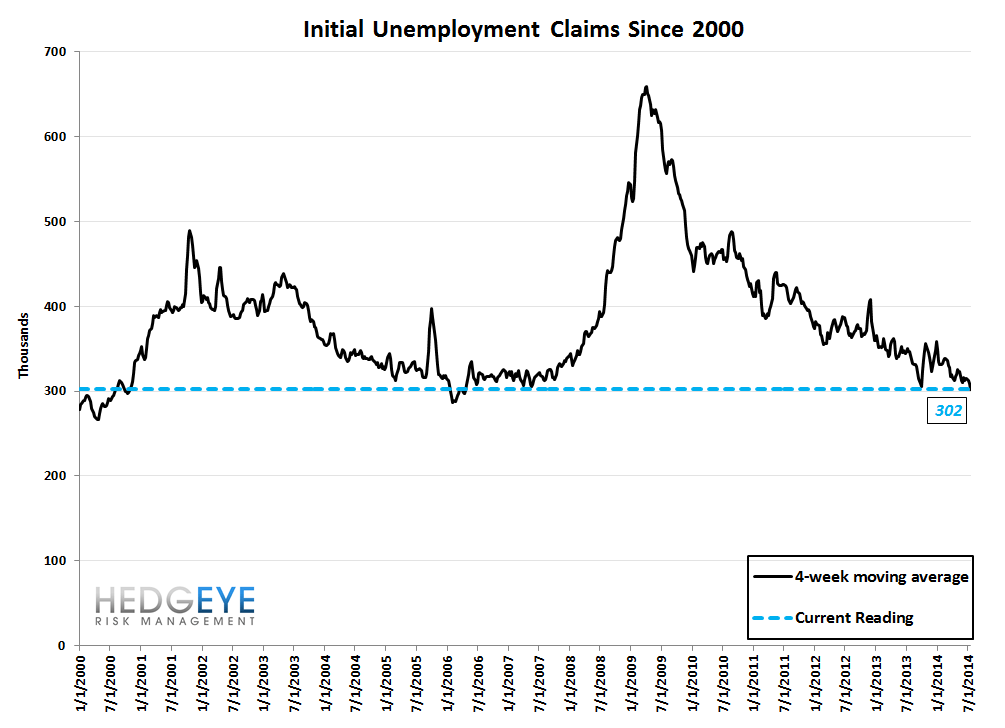
Last week we flagged how the strength in claims represents both risk and opportunity. The opportunity lies in the fact that historically claims tracked at sub-330k for 24 months in the mid-to-late 1980s, 45 months in the mid-to-late 1990s, and 31 months in the 2005-2007 period. Currently, claims have been running at sub-330k for 6 months (though if you count from the initial drop in mid-2013 then we're closer to ~12 months). In other words, history would suggest (the last 3 cycles at any rate) there could be another 18-39 months of track left before claims begin to rise. The risk lies in the fact that major market downturns follow sub-330k claims periods. And, importantly, there's no guarantee the last 3 cycles will reasonably represent the blueprint for this cycle. We often work in close conjunction with our Macro Team on the labor and housing markets. The chart below, illustrating the dynamic, comes from Christian Drake on the Macro Team.
Credit Cards
Credit Cards remain our favorite long on the improvement in initial jobless claims. We've been vocal in our enthusiasm for Capital One (COF) on the long side amid early signs of a resurgence in loan growth arising from increasing willingness to extend credit to subprime borrowers. So long as claims remain low, the coast is clear on the long side here and we expect both better than expected earnings and think there's good likelihood for some multiple expansion.
The Data
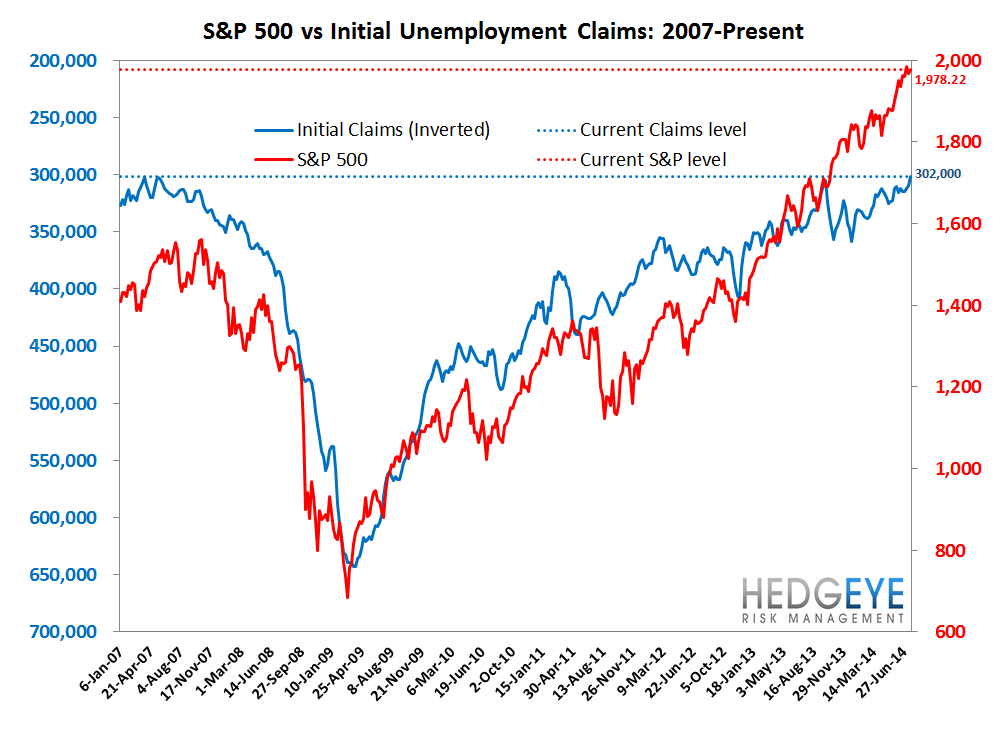
Prior to revision, initial jobless claims fell 18k to 284k from 302k WoW, as the prior week's number was revised up by 1k to 303k.
The headline (unrevised) number shows claims were lower by 19k WoW. Meanwhile, the 4-week rolling average of seasonally-adjusted claims fell -7.25k WoW to 302k.
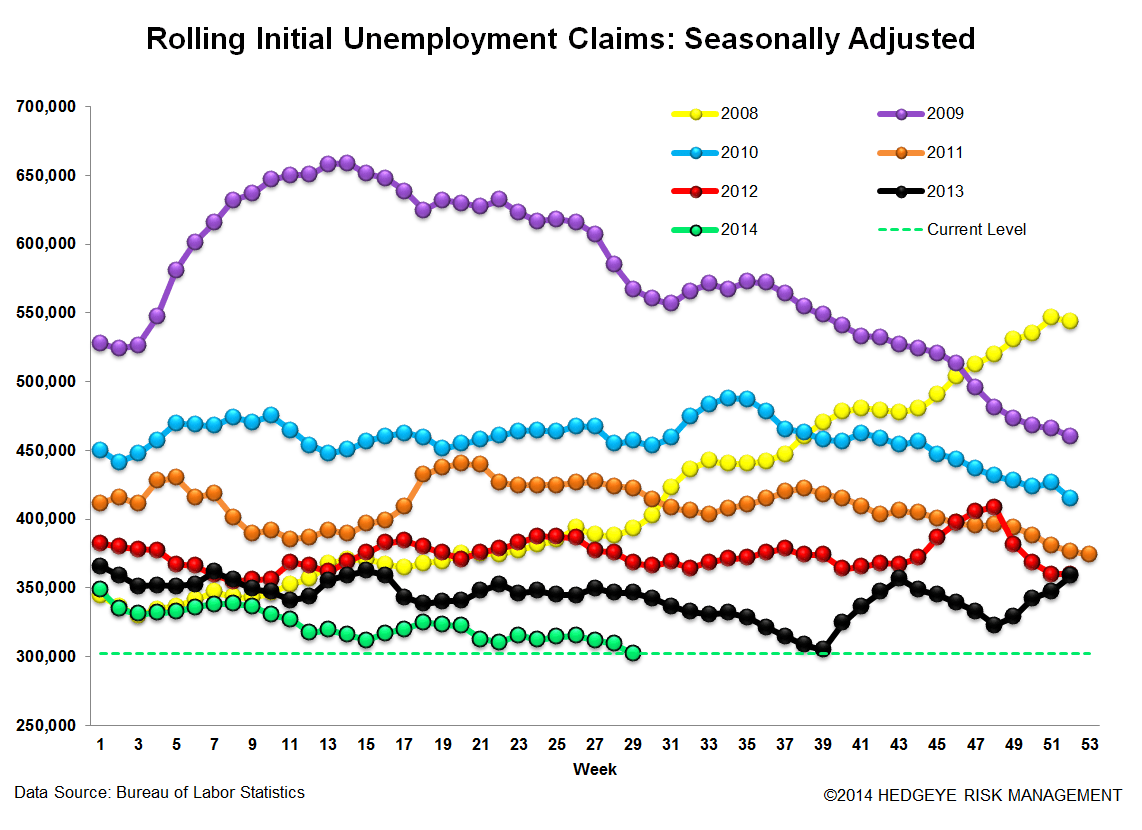
The 4-week rolling average of NSA claims, which we consider a more accurate representation of the underlying labor market trend, was -12.2% lower YoY, which is a sequential improvement versus the previous week's YoY change of -11.1%


Yield Spreads
The 2-10 spread fell -5 basis points WoW to 200 bps. 3Q14TD, the 2-10 spread is averaging 206 bps, which is lower by -15 bps relative to 2Q14.


Joshua Steiner, CFA
Jonathan Casteleyn, CFA, CMT
