Our Hedgeye Housing Compendium table (below) aspires to present the state of the housing market in a visually-friendly format that takes about 30 seconds to consume.

Today's Focus: Existing Home Sales & FHFA HPI
FHFA HPI
The FHFA HPI for May showed home prices decelerated a further -70bps sequentially to +5.5% YoY. With Corelogic and Case-Shiller data for June and April, respectively, reflecting a similar slope of improvement, the three primary HPI measures continue to tell a cohesive story of discrete price deceleration.

Existing Home Sales
The National Association of Realtors (NAR) released its monthly Existing Home Sales report for June earlier this morning.
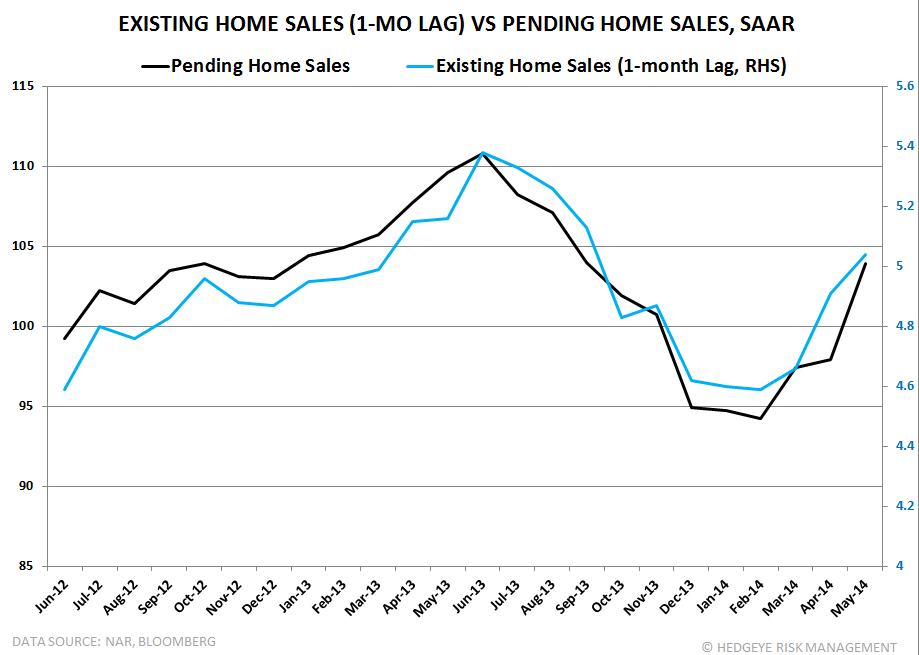
As we've stated here before, there's limited usefulness in the EHS report on the sales side since the data is well-telegraphed by the Pending Home Sales report. We show this in the chart below, where we've offset the EHS data by one month to show its correlation to PHS on a 1-month lag. That being said, there is value in the data on inventory and the composition of sales (first-time buyers, cash buyers, investor share).
EHS Quick Take:
Total Existing Home Sales increased +2.6% MoM against upwardly revised May figures. The year-over-year rate of change remained negative but improved to -2.3% vs -4.7% prior. As highlighted above, the sequential improvement in Existing Home sales was not particularly surprising given the strong +6.1% MoM gain in Pending Home sales reported in May. From a growth perspective, comps peak next month (July 2013 was +17.2% YoY) before getting progressively easier through the balance of 2H.
Regional: All regions showed sequential improvement in the rate of change in YoY growth on a seasonally adjusted basis. Growth in the Northeast/Midwest/West held negative while the South saw +1.0% growth in sales Y/Y – the first month of positive growth since January.
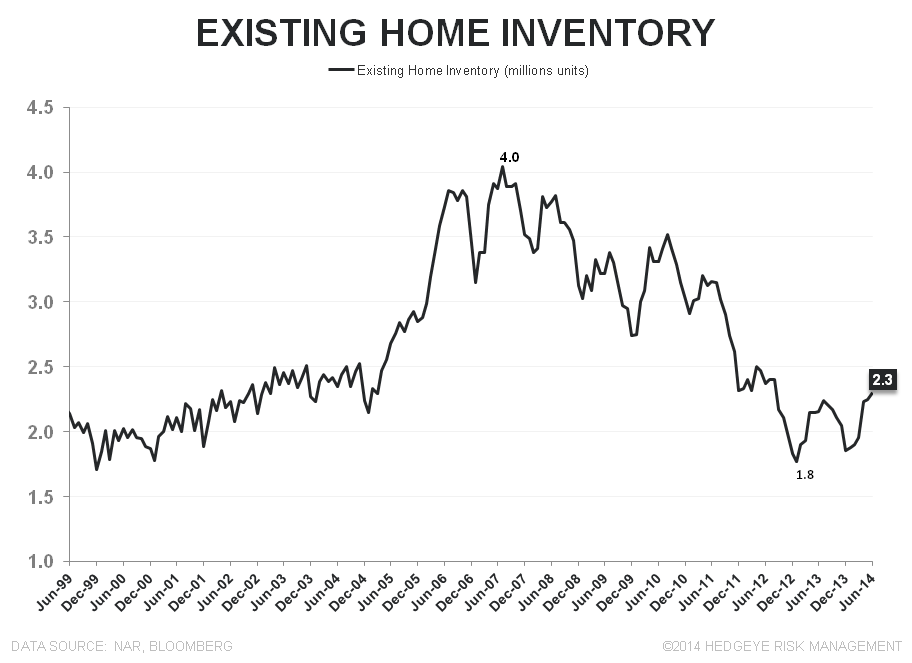
Inventory: On a unit basis, existing home inventory increases 2.2% MoM and +6.48% YoY, marking the fourth consecutive month of accelerating YoY growth in supply. On a months supply basis, inventory declined -0.4% MoM and rose +9.0% YoY as the gain in sales more than offset the inventory increase. Months supply currently stand at 5.5, down from 5.6 last month.
Home Prices: Median home prices continued to increase in the mid-single digits across the South, Midwest and West. Notably, the median home prices in the Northeast registered its 3rd straight month of negative growth.
Other: Distressed sales declined to 11% of the market, Cash sales held at 32% of the market, 1st time homebuyers remained depressed at 28% of the market, and median time on the market improved for a 6th straight month to 44 days (vs 47 prior).


About Existing Home Sales:
The National Association of Realtors’ Existing Home Sales index measures the number of closed resales of homes, townhomes, condominiums, and co-ops. Existing home sales do not take into account the sale of newly constructed homes. Existing home sales account for 85-95% of all home sales (new home sales account for the remainder). Therefore, increases in existing home sales tend to signify increasing consumer confidence in the market. Additionally, Existing Home Sales is a lagging series, as it measures the closing of homes that were pending home sales between 1 and 2 months earlier.
Frequency:
The NAR’s Existing Home Sales index is published between the 20th and the 22nd of each month. The index covers data from the prior month.
Joshua Steiner, CFA
Christian B. Drake
