Investment Company Institute Mutual Fund Data and ETF Money Flow:
In the most recent 5 day period, aggregate bond funds including both taxable and tax free products netted another $2.7 billion in new investor subscriptions. Conversely, the combined equity mutual fund complex had only a slight rebound in fund flow with $700 million coming into the category. The broad take-away is that the U.S. retail investor has been retrenching for most of the first half of the year (with only one week of outflows in the past 22 weeks in taxable bonds and 25 of 26 weeks of tax-free or muni bond inflows). This compares to over 2 consecutive months of outflows in U.S. stock funds. We are positioned accordingly with this emerging asset allocation having removed T Rowe Price from our Best Ideas list on May 14th (see report here) and are positioned more conservatively with our ongoing Long recommendation of leading fixed income manager Legg Mason (see our LM research here).
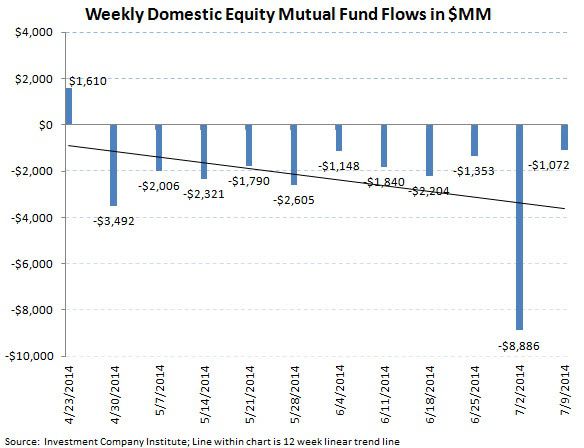
Total equity mutual funds put up a slight inflow in the most recent 5 day period ending July 9nd with $661 million coming into the all stock category as reported by the Investment Company Institute. The composition of the $661 million subscription continued to be weighted towards international equity funds with $1.7 billion coming into international stock funds which was offset by a $1.0 billion redemption in domestic equity products. This drawdown in domestic equity funds has become an intermediate term trend with now the eleventh consecutive week of outflow in the category. The running year-to-date weekly average for equity fund flow is now a $1.9 billion inflow, which is now below the $3.0 billion weekly average inflow from 2013.
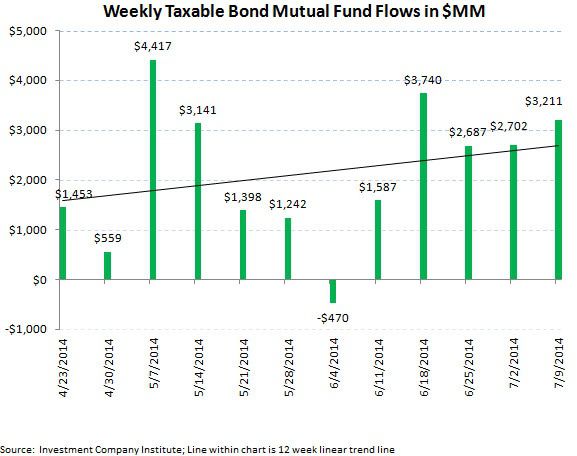
Fixed income mutual fund flows had a decent week of production with the aggregate $2.7 billion that came into the asset class besting the 2014 running year-to-date average inflow of $2.2 billion. The inflow into taxable products of $3.2 billion made it 21 of 22 weeks with positive flow for the category. However municipal bond funds broke their streak of 25 consecutive weeks of inflow with a $482 million outflow. Over the past 5 months over $10.0 billion has flowed back into tax-free or muni products after a significant draw down to end 2013. The 2014 weekly average for fixed income mutual funds now stands at a $2.2 billion weekly inflow, an improvement from 2013's weekly average outflow of $1.5 billion, but still a far cry from the $5.8 billion weekly average inflow from 2012 (our view of the blow off top in bond fund inflow).
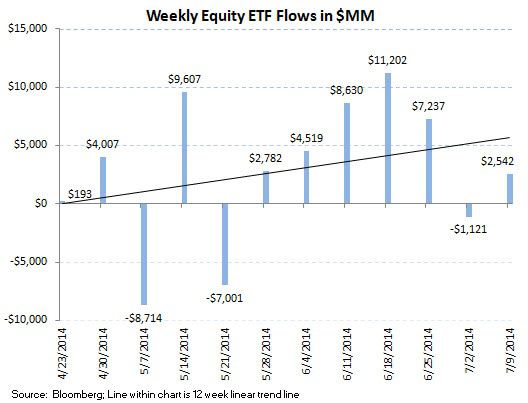
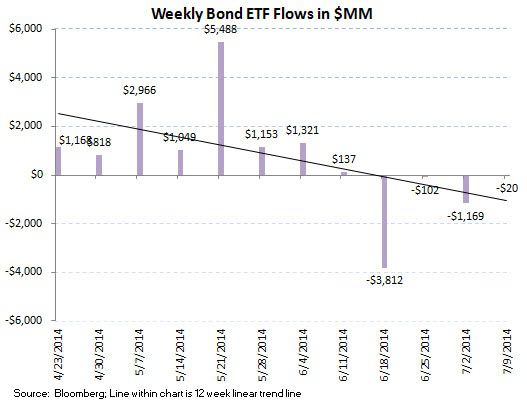
ETF results were mixed during the week with inflows into equity funds and outflows in fixed income products. Equity ETFs put up a $2.5 billion subscription, making it 6 of 7 weeks with significant inflows, while fixed income ETFs suffered another outflow of $20 million. The 2014 weekly averages are now a $1.6 billion weekly inflow for equity ETFs and a $824 million weekly inflow for fixed income ETFs.
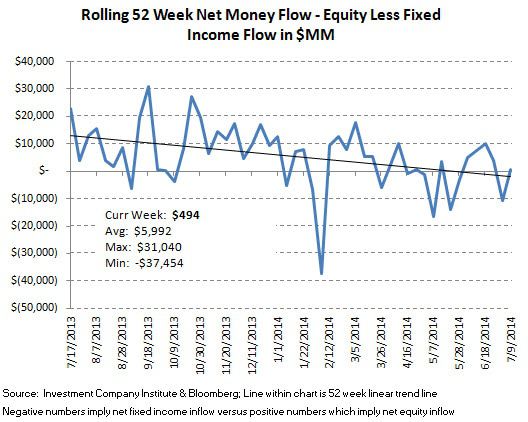
The net of total equity mutual fund and ETF trends against total bond mutual fund and ETF flows totaled a positive $494 million spread for the week ($3.2 billion of total equity inflow versus the $2.7 billion inflow within fixed income; positive numbers imply greater money flow to stocks; negative numbers imply greater money flow to bonds). The 52 week moving average has been $5.8 billion (more positive money flow to equities), with a 52 week high of $31.0 billion (more positive money flow to equities) and a 52 week low of -$37.5 billion (negative numbers imply more positive money flow to bonds for the week).
Mutual fund flow data is collected weekly from the Investment Company Institute (ICI) and represents a survey of 95% of the investment management industry's mutual fund assets. Mutual fund data largely reflects the actions of retail investors. Exchange traded fund (ETF) information is extracted from Bloomberg and is matched to the same weekly reporting schedule as the ICI mutual fund data. According to industry leader Blackrock (BLK), U.S. ETF participation is 60% institutional investors and 40% retail investors.


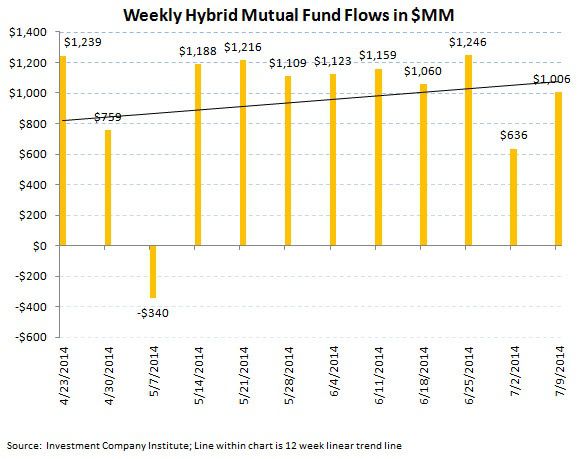
Most Recent 12 Week Flow in Millions by Mutual Fund Product:


Most Recent 12 Week Flow Within Equity and Fixed Income Exchange Traded Funds:
Net Results:
The net of total equity mutual fund and ETF trends against total bond mutual fund and ETF flows totaled a positive $494 million spread for the week ($3.2 billion of total equity inflow versus the $2.7 billion inflow within fixed income; positive numbers imply greater money flow to stocks; negative numbers imply greater money flow to bonds). The 52 week moving average has been $5.8 billion (more positive money flow to equities), with a 52 week high of $31.0 billion (more positive money flow to equities) and a 52 week low of -$37.5 billion (negative numbers imply more positive money flow to bonds for the week).
Jonathan Casteleyn, CFA, CMT
Joshua Steiner, CFA
