Our Hedgeye Housing Compendium table (below) aspires to present the state of the housing market in a visually-friendly format that takes about 30 seconds to consume.

Today's Focus: July NAHB HMI (Builder Confidence Survey) & MBA Mortgage Applications
July NAHB HMI
This month (July), the NAHB’s HMI, which measures builder confidence, rose to 53, a gain of four points from June's print of 49 (which was not subject to any revision) and the highest reading in six months. For reference, the last two months have seen a total improvement of 8 points.
- Sub-Indices: All 3 sub-indices increased MoM although expectations registered a disproportionate increase, gaining +7pts sequentially and sending the “optimism spread” back to its highest levels since 3Q12.
- Regional: All regions showed sequential improvement for a 2nd straight month.
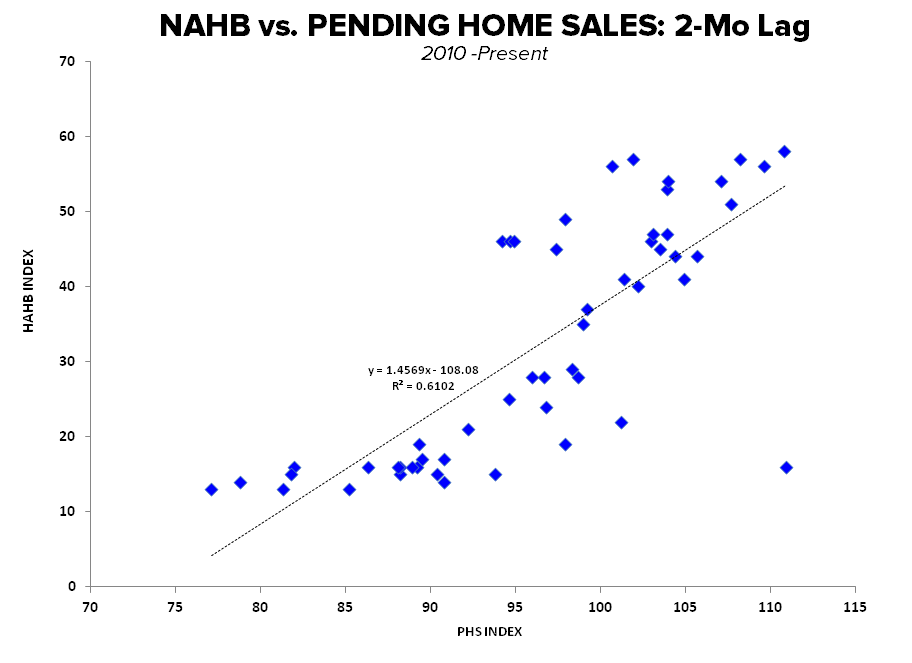
NAHB vs. Pending Home Sales: On a LT basis, the correlation between NAHB and Pending Home Sales is strongest on a coincident basis. However, since 2010 (when Pending bottomed) the strongest relationship is with Pending leading changes in Builder Optimism by ~2 Months (which makes temporal sense as the NAHB HMI is released ~2 months ahead of Pending, with Pending offering a cue/anchor for builder expectations).
Given the autocorrelation and colinearity in housing metrics, resolving the growing divergence between Pending & Purchase Apps and discerning the true trajectory in purchase demand will become increasingly important.
Turning to the commentary, note the stark and somewhat whimsical reversal of spin with respect to the numbers the last couple months:
NAHB Chairman Kevin Kelly had this to say on the July reading:
“This is the first time that builder confidence has been above 50 since January and an important sign that it is strengthening as pent-up demand brings more buyers into the marketplace
For reference, here's what Kevin Kelly said a month ago:
“After several months of little fluctuation, a four-point uptick in builder sentiment is a welcome sign and shows some renewed confidence in the industry. However, builders are facing strong headwinds, including the limited availability of labor.”
While NAHB's Chief Economist, David Crowe, added this:
“An improving job market goes hand-in-hand with a rise in builder confidence. As employment increases and those with jobs feel more secure about their own economic situation, they are more likely to feel comfortable about buying a home.”
And here's what David Crowe said a month earlier:
“Consumers are still hesitant, and are waiting for clear signals of full-fledged economic recovery before making a home purchase. Builders are reacting accordingly, and are moving cautiously in adding inventory.”


MBA Mortgage Applications
The Mortgage Bankers Association today released its weekly mortgage applications survey data for the week ended July 11.
In short, it’s getting increasingly interesting to start 3Q. While HPI remains in conspicuous deceleration, the divergence between various measures of housing activity are growing more stark – is demand really in discrete retreat, is the latest high frequency data reflective of peri-holiday related volatility, is the shift in non-bank origination really that remarkable?
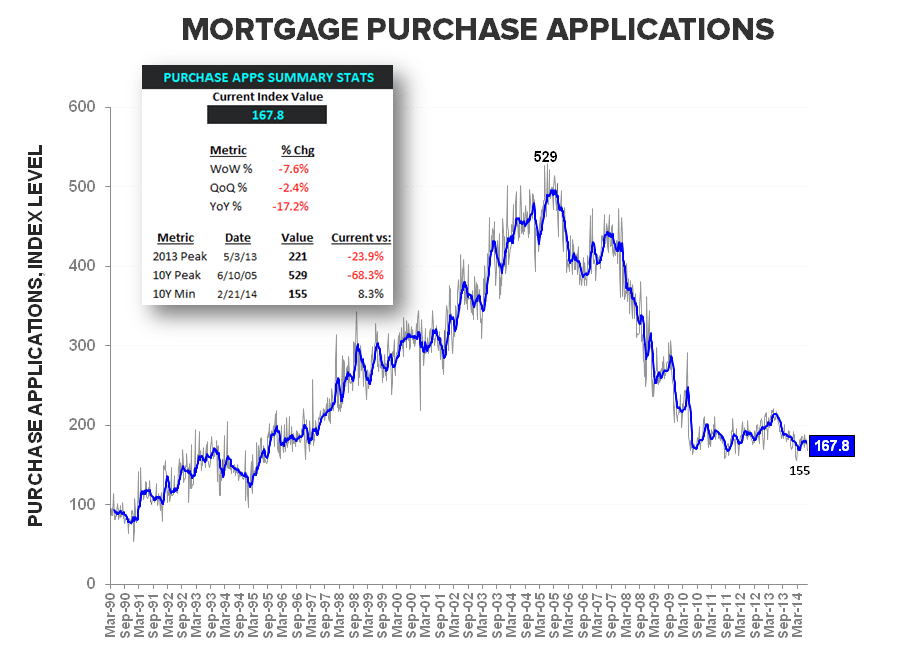
Mortgage demand softened significantly in the latest week with the composite index declining -3.6% in the post-holiday week with the purchase index declining -7.6% WoW .
- Purchase Apps: Purchase Demand declined -7.6% WoW, posting its largest sequential drop since February 2013. The index dropped to its lowest level since February, completely bypassing the 170-level to close at 167.8 (181.7 prior). The YoY rate of change deteriorated to -17.2% from -9.9% prior with the early 3Q data tracking at -2.4% QoQ. Historically, outside of 2009 and amidst the throes of the recession, purchase demand hasn’t shown any notable volatility in the week following the july 4th holiday, suggesting the decline in purchase activity is authentic.
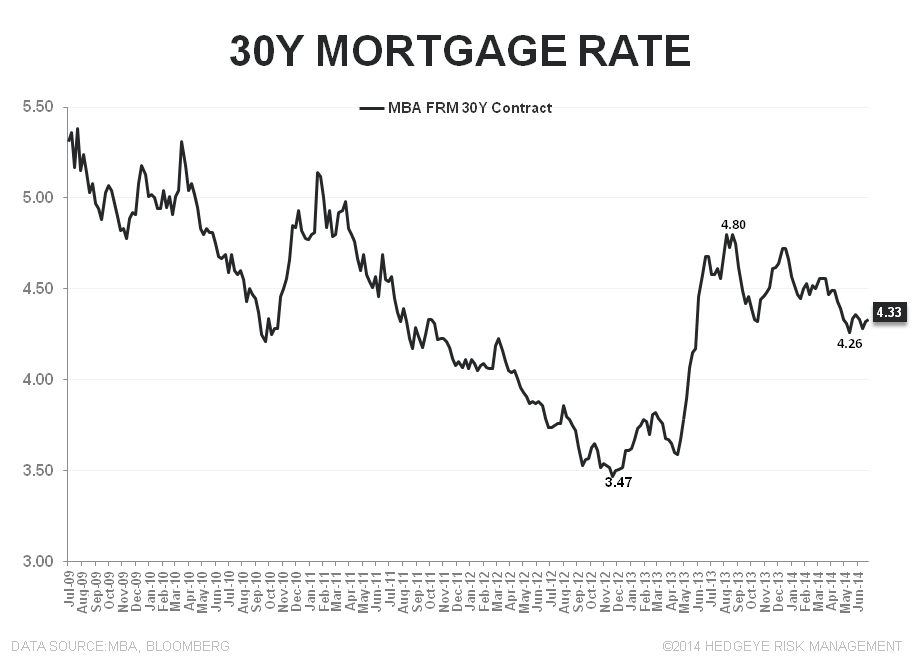
- Refi: Refi activity was largely unremarkable WoW, declining -11 bps alongside little change in 30Y rates.
- 30Y FRM: 30 year interest rates on conventional fixed rate contracts were largely unchanged WoW, increasing to 4.33% from 4.32% according to MBA data. Rates remain near the lowest levels since May of last year.
Here are a few other recent anecdotals:
- Lumbar Liquidators: In a nutshell, the stock is down ~25% in the last week as 2Q14 Comps came in ~14% below analyst estimates and the company aggressively guided lower. Here's what management had to say:
- "Customer traffic to our stores was significantly weaker than we expected, particularly in geographic areas severely impacted by the unusually harsh weather in the first quarter. The improvement in customer demand we experienced beginning in mid-March did not carry into May, and June weakened further. Our reduced customer traffic has coincided with certain weak macroeconomic trends related to residential remodeling, including existing home sales, which have generally been lower in 2014 than the corresponding periods in 2013. We now believe the prolonged purchase cycle associated with our customers' discretionary, large-ticket home improvement projects is likely to be delayed for some customers into the fall flooring season, and for others, into spring of 2015."
- Inside Mortgage Finance: Paul Muolo, publisher of Inside Mortgage Finance, had this to say recently (7/11):
- This week, when Inside Mortgage Finance published its preliminary origination forecast for the second quarter, we caused a bit of whiplash among certain analysts, who believe there’s no way the number can be right. But we’re sticking by the preliminary $310 billion figure, which represents a 32 percent sequential gain. From what we’ve been hearing, the purchase-money business is picking up and more depositories are funding jumbos, keeping the loans in portfolio. We should point out that Friday morning Wells Fargo reported that its production volume jumped 31 percent in 2Q. Wells, by the way, has been doing a little worse than the overall market the past several quarters…
- Phoenix Housing Market: We recently read an interesting summary of the Greater Phoenix Housing situation - the report can be found here (h/t ZH). To summarize, sales are way down and largely because the investor base has flown the coop. Historically, prices follow demand by a 12-18 month lag as it takes time for reality to set in with sellers. We regard Phoenix as proxy for all markets that were similarly inflated by institutional demand.
- Sales of single family homes were down 19% in May 2014 from May 2013 while sales of townhouse/condos were down 20%.
- Single family home sales decreased year over year across every sector:
o Normal re-sales (down 2%)
o New homes (down 4%)
o Investor flips (down 53%)
o Short sales and pre-foreclosures (down 73%)
o Bank owned homes (down 20%)
o GSE (Fannie Mae, Freddie Mac, etc.) owned homes (down 44%)
o HUD sales (down 76%)
o Third party purchases at trustee sale (down 59%) - However the new home sector did grow 22% year over year in Pinal County


About the NAHB HMI:
The Housing Market Index (HMI) is based on a monthly survey of NAHB members designed to take the pulse of the single-family housing market. The monthly survey has been conducted for 30 years. The survey asks respondents to rate market conditions for the sale of new homes at the present time and in the next 6 months as well as the traffic of prospective buyers of new homes. The HMI is a weighted average of separate diffusion indices for these three key single-family series. The HMI can range from 0 to 100, where a value over 50 implies conditions are, on average, improving, a value below 50 implies conditions are worsening, and an index value of 50 indicates that the housing market is neither improving nor worsening.
About MBA Mortgage Applications:
The Mortgage Bankers’ Association’s mortgage applications index covers more than 75% of mortgage applications originated through retail and consumer direct channels. It does not include loans delivered through wholesale broker and correspondent channels. The MBA mortgage purchase applications index is considered a leading indicator of single-family home sales and construction. Moreover, it is the only housing index that is released on a weekly basis.
Frequency:
The MBA Purchase Apps index is released every Wednesday morning at 7 am EST.
Joshua Steiner, CFA
Christian B. Drake