Investment Ideas
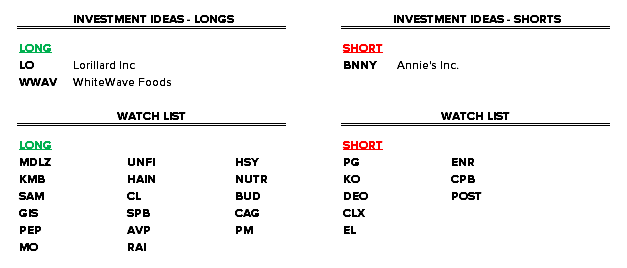
The table below lists our current investment ideas as well as a list of potential ideas we are in the process of evaluating (watch list). We intend to update this table regularly and will provide detail on any material changes.
EVENTS THIS WEEK
7/17/14 PM Earnings Call 9am EST
WEEK-OVER-WEEK PERFORMANCE
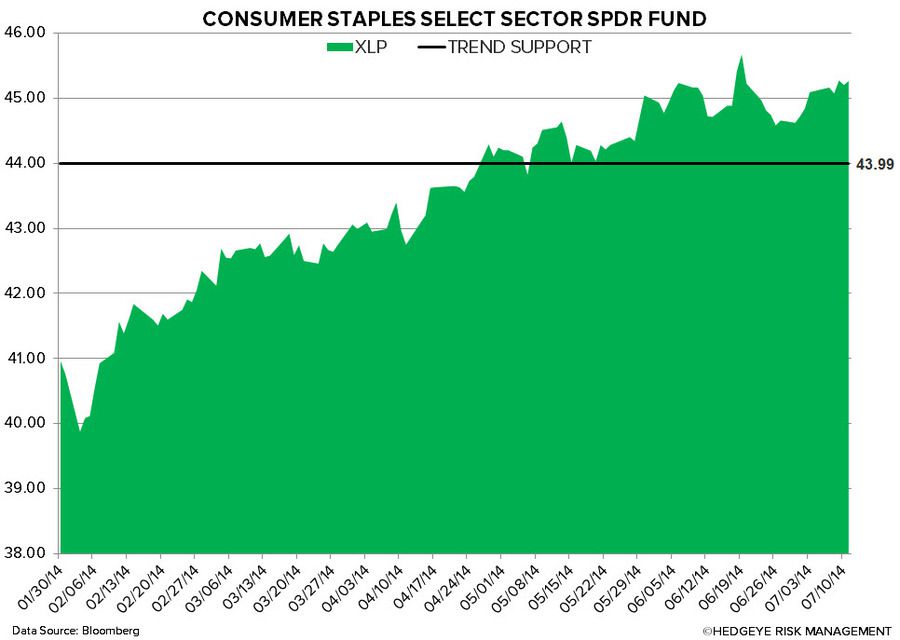
Consumer Staples rose +0.4% week-over-week versus the broader market (S&P500) down -0.9 %. XLP is up 5.3% year-to-date versus the SPX at 6.5%.
Positive Divergence: ADM 4.5%; SAFM 3.8%; TSN 3.0%; LO 2.5%; MO 2.5%
Negative Divergence: SODA -7.8%; NUS -4.6%; SMG -4.1%; THS -3.4%; HAIN -2.8%
RECENT NOTES
- Riding Out the LO Gravy Train!
- Join Our Expert E-Cig "Speaker Series" - Are Vaporizers Stealing Share from Big Tobacco?
XLP remains bullish on immediate term TRADE and intermediate term TREND durations from a quantitative set-up.
The Hedgeye U.S. Consumption Model shows 6 of the 12 U.S. Economic Indicators flashing green.

Despite the bullish quantitative set-up for the sector, we continue to believe that the group is facing numerous headwinds, including:
- U.S. consumption growth is slowing as inflation rises, in-line with the Macro team’s 1Q14 theme of #InflationAccelerating, Q2 2014 theme of #ConsumerSlowing, and Q3 2014 theme of #Q3 Slowing
- The economies and currencies of the emerging market – once the sector’s greatest growth engine – remain weak with the prospect of higher inflation in 2014 eroding real growth
- The sector is loaded with a premium valuation (P/E of 20.0x)
- Less sector Yield Chasing as Fed continues its tapering program
- The high frequency Bloomberg weekly U.S. Consumer Comfort Index (rescaled for cosmetic and not component reasons) has not seen any real improvement over the past 6 months, but rose to 37.6 versus 36.4 in the prior week


QUANTITATIVE SETUP
In the charts below we look at the largest companies by market cap in the Consumer Staples space from a quantitative perspective.
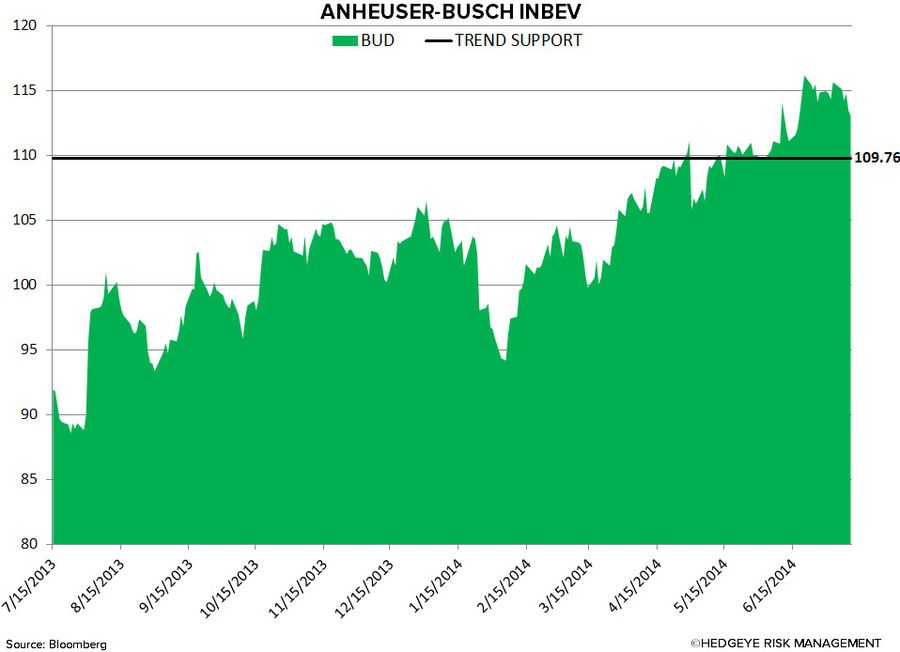
BUD – bullish TRADE and TREND w/ TREND support = 109.76
DEO – bullish TRADE and TREND w/ TREND support = $124

KO – bullish TRADE and TREND w/ TREND support = 40.72

PEP – bullish TRADE and TREND w/ TREND support = 86.39

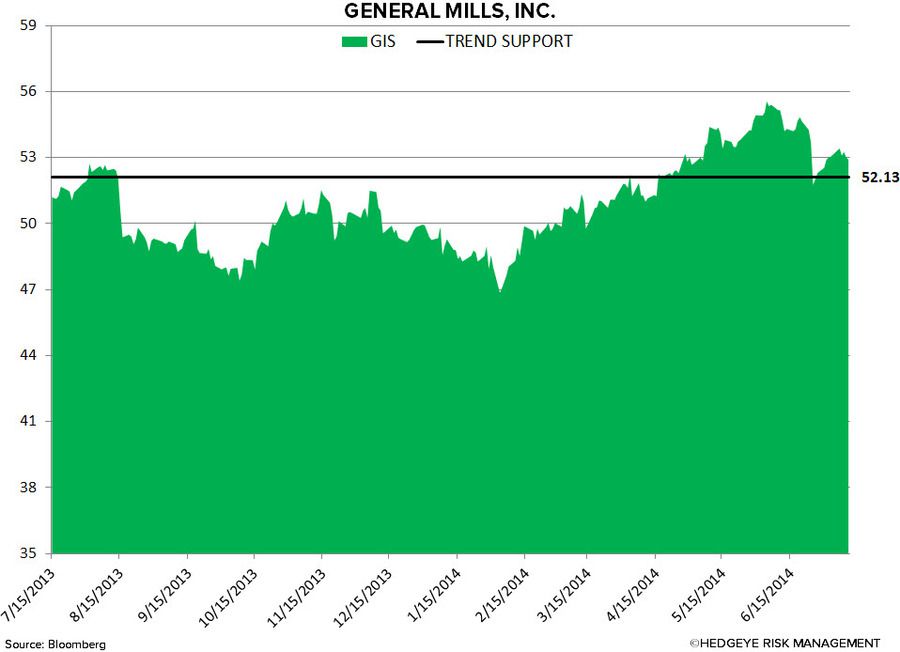
GIS – bullish TRADE and TREND w/ TREND support = 52.13
MDLZ – bullish TRADE and TREND w/ TREND support = 36.32

KMB – bullish TRADE and TREND w/ TREND support = 110.02

PG – bullish TRADE and TREND w/ TREND support = 80.29

MO – bullish TRADE and TREND w/ TREND support = 40.28

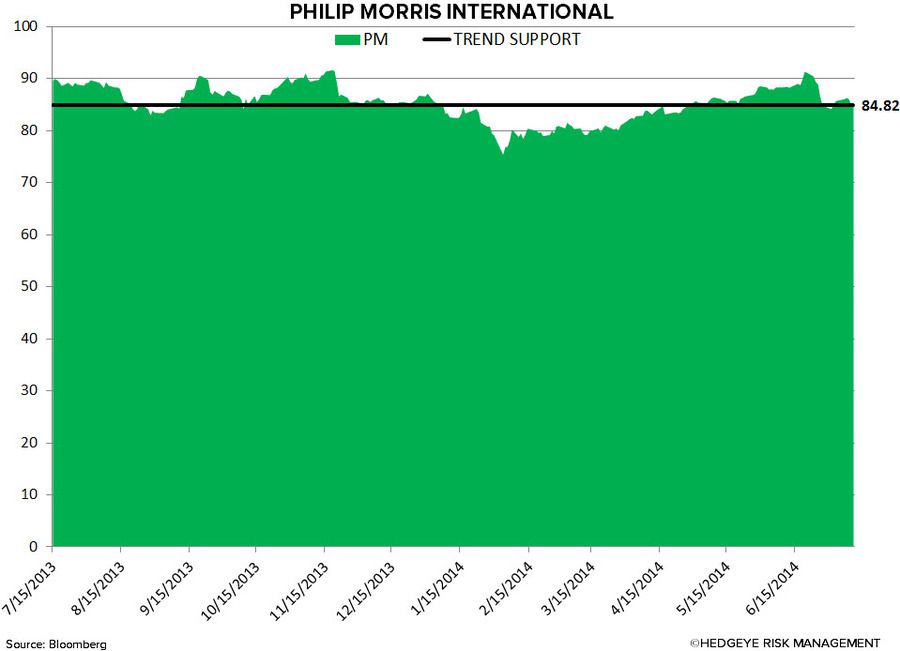
PM – bearish TRADE (86.77 resistance); bullish TREND (84.82 support)
Howard Penney
Managing Director
Matt Hedrick
Associate
Fred Masotta
Analyst