Volatility can turn quickly with high-frequency data, and currently equities aren’t the only asset class with a relatively complacent outlook on market catalysts into the summer months.
With commodities being the biggest outperformer through the first half of 2014, the CRB Index (+8.50% YTD) is experiencing its largest YTD increase since 2009 (+13.20%). What started off as some of the most volatile markets across all asset classes on the speculation of a drought in the U.S., investors in the grain markets remain skeptical of a forward-looking catalyst for price action into the harvest.
- Basis on 1st and 2nd month corn futures is trading at a year-to-date high (Jul-Sep. spread)
- Spot implied volatility has trended back to historical averages from April highs


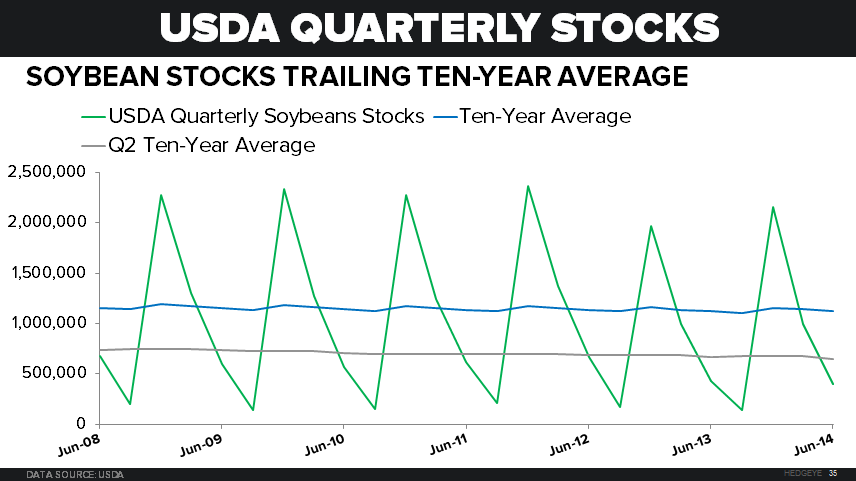
Arguably the most important grain number of the year into the heat of harvesting season, the USDA reported Q2 stockpiles. The report shuddered any pre-season threat of a drought-fueled rally into harvest season. The USDA estimates Corn and Soybean Stocks may reach record levels. Bullish sentiment as measured by the CFTC’s weekly reporting of the net length of aggregate futures and options positions in the market peaked with prices at the end of April and has since declined significantly:


- Corn: After rallying to +22% on the year through the end of April, corn is now trading in negative territory after the print showed higher than expected stockpiles for Q2. The USDA now estimates the largest stock ever for the 2014 harvest:
- Q2 Stocks: 3.85Bn vs. 3.72Bn estimate
- 2014 USDA estimate: 13.94Bn Bushels (all-time high)

- Soybeans: After reaching +17% YTD at the end-of-April highs, soybeans have since retreated -10% to +7% through Q2. The USDA report this week also exceeded expectations with record acreage expected to be planted
- Q2 Stocks: 405MM vs. 382MM estimate
- Wheat: Reached a may 6th YTD high of +21% and has since plunged to -7% through Q2 (-4.5% week-to-date)
- Q2 Stocks: 590MM vs. 597MM estimate

The consumption of commodities is paid for in real, inflation-adjusted U.S. Dollars. With the driving force of high-frequency macro data points changing forward-looking expectations for the dollar and rates on a daily basis, the outlook for those who consume in U.S. dollars moves in tandem. We observe a noticeable relationship between these marginal changes and commodity prices and believe this will continue to be a potentially catalyst inducing volatility in commodity markets, weather aside.
Ben Ryan
Analyst