Our Hedgeye Housing Compendium table (below) aspires to present the state of the housing market in a visually-friendly format that takes about 30 seconds to consume.

*Note - to maintain cross-metric comparability, the purchase applications index shown in the table above represents the monthly average as opposed to the most recent weekly data point.
Today's Focus: May Pending Home Sales Index
The National Association of Realtors (NAR) today released its Pending Home Sales Index for the month of May.
Pending Home Sales rose by 6.1% month-over-month to an index level of 103.9 (vs 97.9 in April). For reference, an index value of 100 corresponds to the average level of contract activity in the year 2001. While the report was positive month-over-month, contract activity remains down year-over-year by 5.2%. This is a stark contrast vs where we were one year ago, when contract activity was running +10.7% year-over-year.
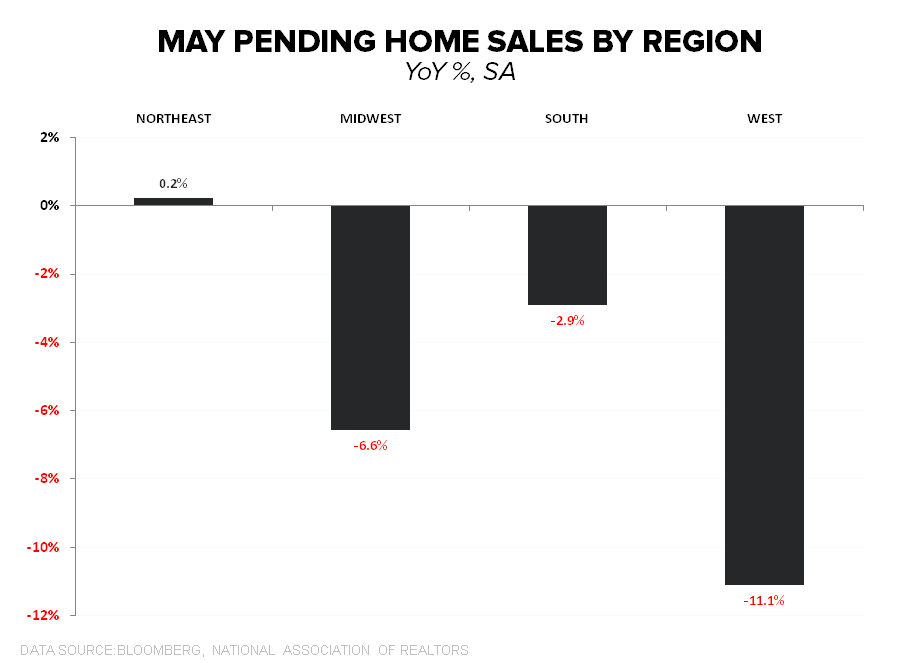
Geographically, weakness on a year-over-year basis was most notable in the West, where volume was down 11.1% Y/Y, while the Northeast looked the best (& the lone region registering positive growth) at +0.2%.
This morning's data is notable for two reasons. First, it shows substantial strength in the contract volume of existing homes being sold. Second, it shows substantial divergence relative to mortgage purchase applications data.
As the first chart below shows, the Pending Home Sales index and MBA Purchase Applications index are substantially dislocated right now. Historically, the two series have had a strong tendency towards co-integration, meaning that when they diverge they tend to re-connect a short while later.
We'll get the final weekly print for June mortgage purchase applications data in two days, and barring a moonshot of a print we would expect substantial weakness from the June Pending Home Sales report in one month's time.


About Pending Home Sales:
The Pending Home Sales Index is a monthly data release from the National Association of Realtors (NAR) and is considered a leading indicator for housing activity in the US. It is a leading indicator for Existing Home Sales, not New Home Sales. A pending home sale reflects the signing of a contract, but not the closing of the transaction, which occurs 1-2 months later. The NAR uses data from the MLS and large brokers to calculate the Pending Home Sales index. An index value of 100 corresponds to the average level of activity during 2001.
Frequency:
The NAR Pending Home Sales index is released between the 25th and the 31st of each month and covers data from the prior month.
Joshua Steiner, CFA
Christian B. Drake
