Investment Company Institute Mutual Fund Data and ETF Money Flow:
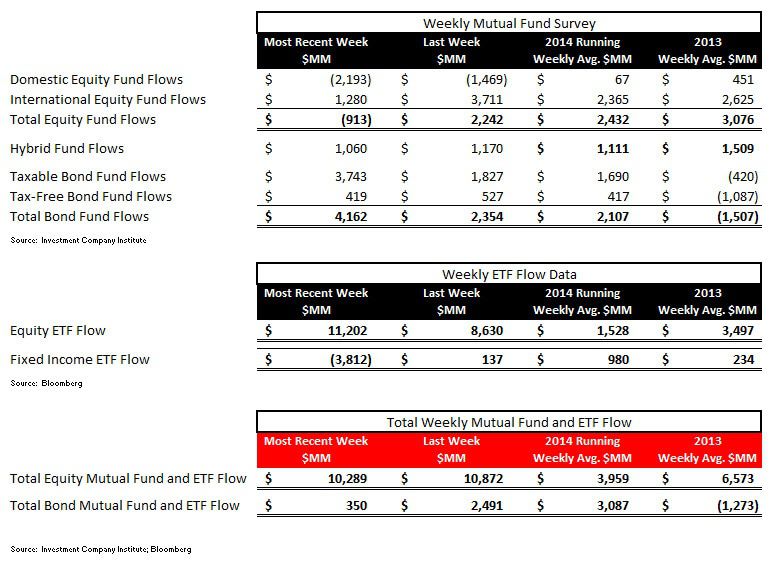
In the most recent 5 day period, aggregate bond funds including both taxable and tax free products netted another $4.1 billion in new investor subscriptions. Conversely, the combined equity mutual fund complex shed almost $1 billion in outflows with significant domestic equity outflows offset by a slight international equity fund inflow. The broad take away is that the U.S. retail investor has been retrenching for most of the first half of the year (with 19 consecutive weeks of taxable bond inflows and 23 consecutive weeks of tax-free or muni bond inflows). Interestingly however, equity ETF flows last week were the best in all of 2014 with a robust $11.2 billion coming into passive equity products versus a significant $3.8 billion outflow in bond ETFs. We think this reflects stronger institutional demand for equities with non-retail firms allocating into the stocks at current levels despite the strong run this cycle with institutional investors also positioning for more pain in fixed income over a longer term perspective with significant outflows this week.
Total equity mutual funds put up a modest outflow in the most recent 5 day period ending June 18th with $913 million coming out of the all stock category as reported by the Investment Company Institute. The composition of the $913 million redemption continued to be weighted towards domestic equity funds with $2.1 billion coming out of domestic stock funds which was offset by a $1.2 billion inflow into international products. This outflow within domestic equity funds has become an intermediate term trend with now the eighth consecutive week of outflow in the category. The aggregate redemption of $913 million for the recent five day period was below the year-to-date average for equity funds of a $2.4 billion inflow, which is now running below the $3.0 billion weekly average inflow from 2013.
Fixed income mutual fund flows had a solid week of production with the aggregate $4.1 billion that came into the asset class besting the 2014 running year-to-date average inflow of $2.1 billion. The inflow into taxable products of $3.7 billion was the 19th consecutive week of positive flow and the inflow into municipal or tax-free products of $419 million was the 23rd consecutive week of positive subscriptions. The 2014 weekly average for fixed income mutual funds now stands at a $2.1 billion weekly inflow, an improvement from 2013's weekly average outflow of $1.5 billion, but still a far cry from the $5.8 billion weekly average inflow from 2012 (our view of the blow off top in bond fund inflow).
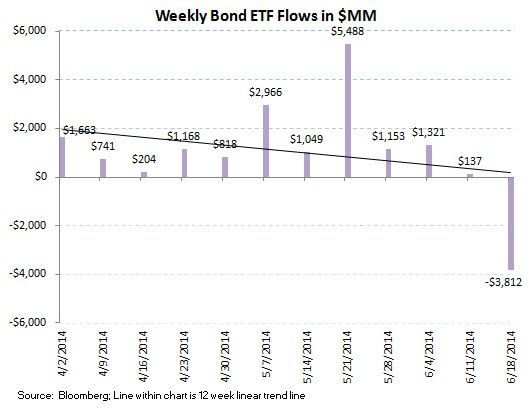
ETF results created the tale of two tapes with equity ETFs putting up the strongest week of production all year offset by weak passive bond flows. Equity ETFs experienced a 2014 best $11.2 billion inflow, while fixed income ETFs suffered a $3.8 billion redemption. The 2014 weekly averages are now a $1.5 billion weekly inflow for equity ETFs and a $980 million weekly inflow for fixed income ETFs.
The net of total equity mutual fund and ETF trends against total bond mutual fund and ETF flows totaled a positive $9.9 billion spread for the week ($10.2 billion of total equity inflow versus the $350 million inflow within fixed income; positive numbers imply greater money flow to stocks; negative numbers imply greater money flow to bonds). The 52 week moving average has been $6.9 billion (more positive money flow to equities), with a 52 week high of $31.0 billion (more positive money flow to equities) and a 52 week low of -$37.5 billion (negative numbers imply more positive money flow to bonds for the week).
Mutual fund flow data is collected weekly from the Investment Company Institute (ICI) and represents a survey of 95% of the investment management industry's mutual fund assets. Mutual fund data largely reflects the actions of retail investors. Exchange traded fund (ETF) information is extracted from Bloomberg and is matched to the same weekly reporting schedule as the ICI mutual fund data. According to industry leader Blackrock (BLK), U.S. ETF participation is 60% institutional investors and 40% retail investors.
Most Recent 12 Week Flow in Millions by Mutual Fund Product:


Most Recent 12 Week Flow Within Equity and Fixed Income Exchange Traded Funds:

Net Results:
The net of total equity mutual fund and ETF trends against total bond mutual fund and ETF flows totaled a positive $9.9 billion spread for the week ($10.2 billion of total equity inflow versus the $350 million inflow within fixed income; positive numbers imply greater money flow to stocks; negative numbers imply greater money flow to bonds). The 52 week moving average has been $6.9 billion (more positive money flow to equities), with a 52 week high of $31.0 billion (more positive money flow to equities) and a 52 week low of -$37.5 billion (negative numbers imply more positive money flow to bonds for the week).

Jonathan Casteleyn, CFA, CMT
Joshua Steiner, CFA
