Our Hedgeye Housing Compendium table (below) aspires to present the state of the housing market in a visually-friendly format that takes about 30 seconds to consume.

Today's Focus: May New Home Sales & April Case-Shiller and FHFA
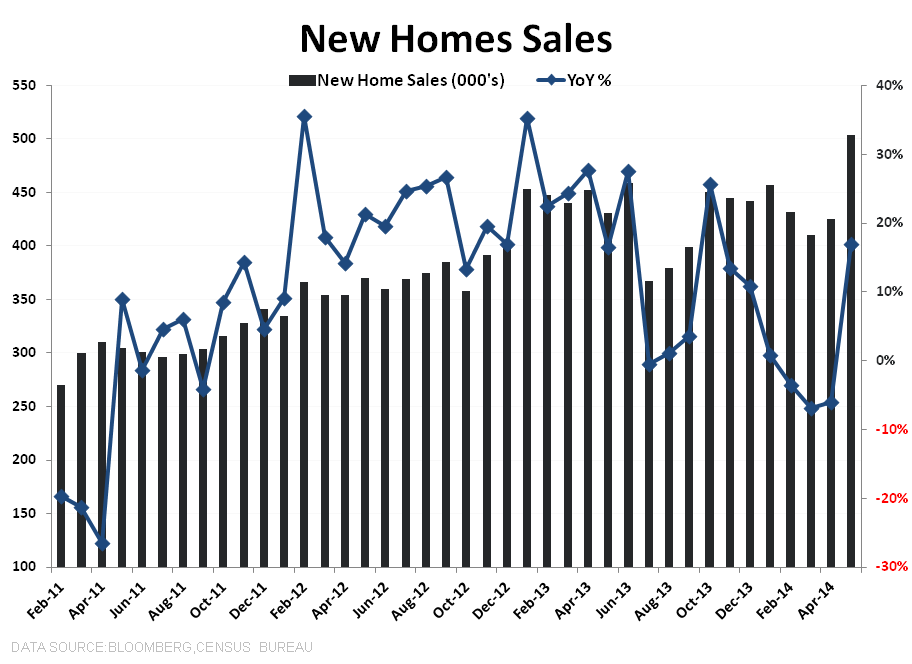
May New Home Sales - Key Takeaways
* Solid report as New Home Sales increase +75K sequentially (+18.6% MoM) in May, with the YoY reversing to +17% after three consecutive months of negative YoY growth.
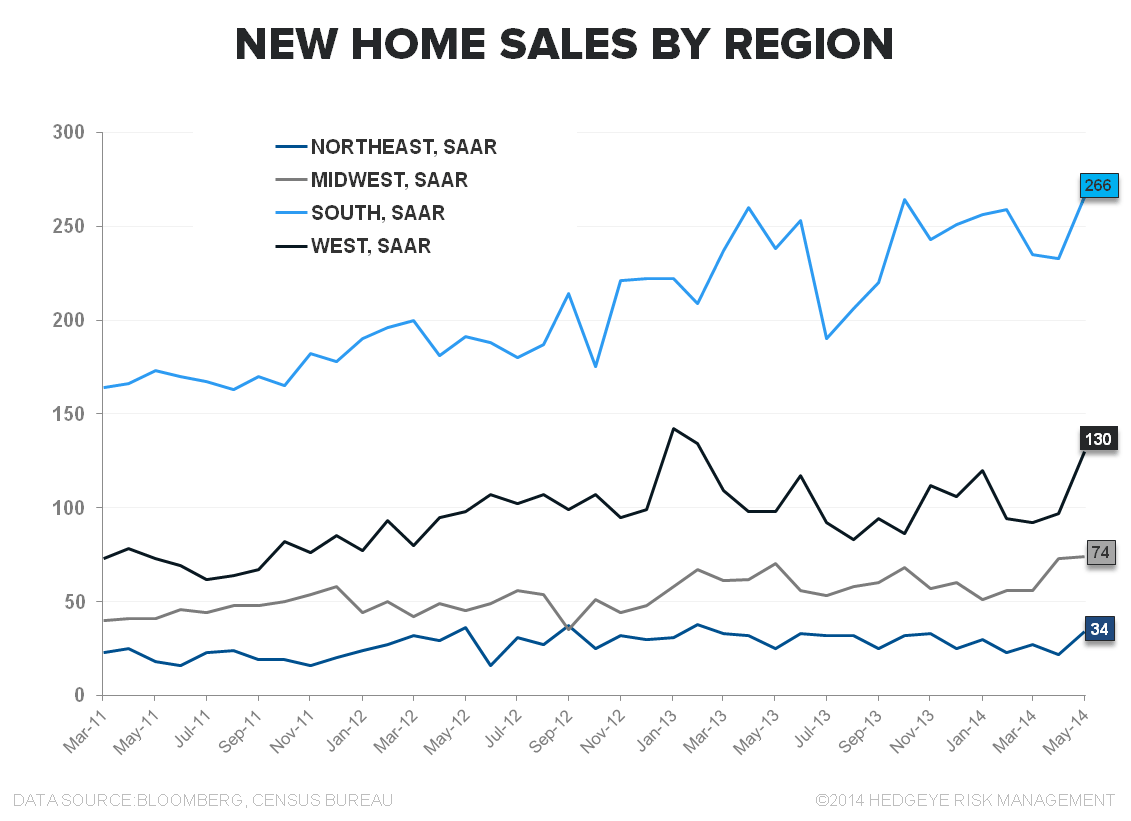
* All regions showed positive accelerations in sales – most notably, the Northeast region saw YoY Sales improve to +36% YoY in May after negative year-over-year growth of -39.5%, -18.2%, and -31.3% over the February-April period.
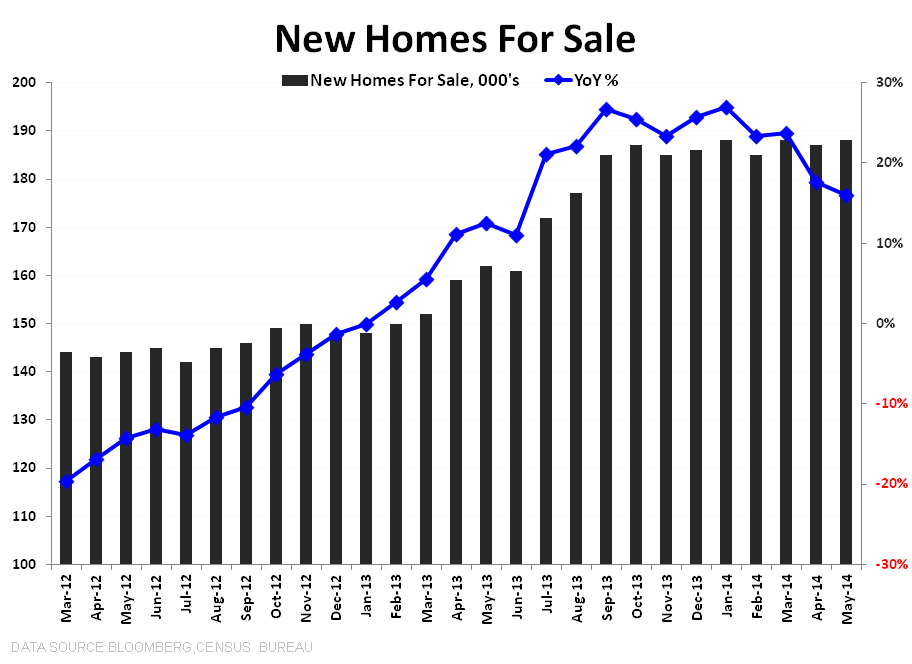
* Inventory: New Homes for Sale increased to 188K from 187K prior – an increase of +0.5% MoM and +16% YoY.
So, for reasons we’ve highlighted previously (QM, Investor Demand, Student Loan debt & Lower tier income growth stagnation, etc), the new Home market continues to look better on balance than the existing market where the 750K+ tier remains the primary source of strength.


April S&P/Case-Shiller Home Price Report (& FHFA) - Key Takeaways
The rearview report for April (effectively March data for CS) says…..
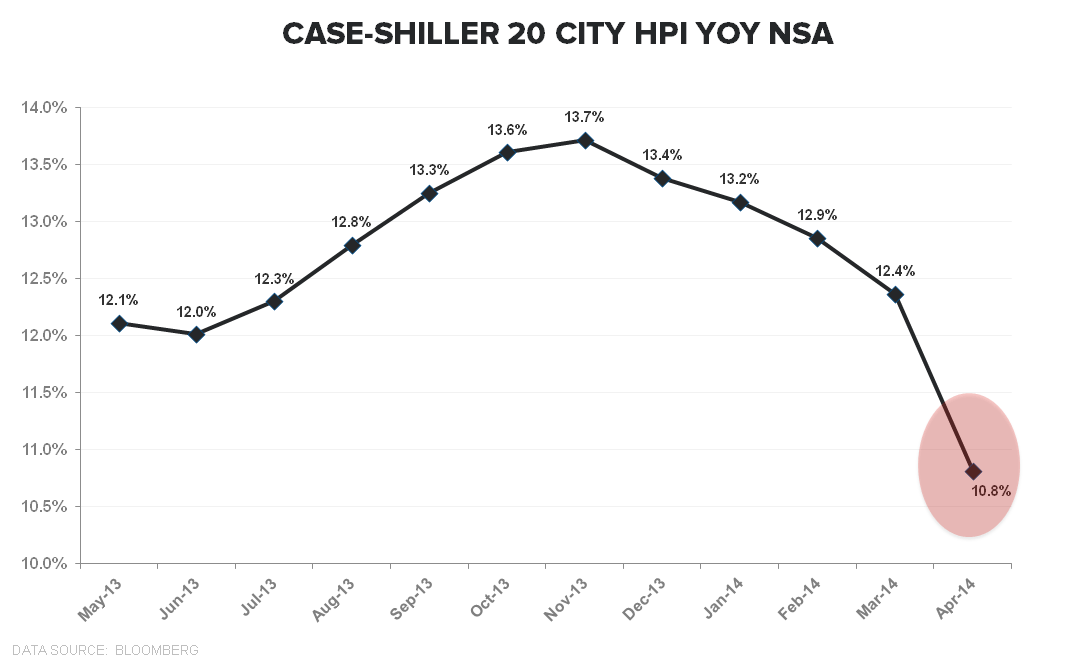
* All primary price indices telling a congruous story with price deceleration now in full effect across Corelogic, Case-Shiller & FHFA, with the deceleration accelerating in the latest readings.
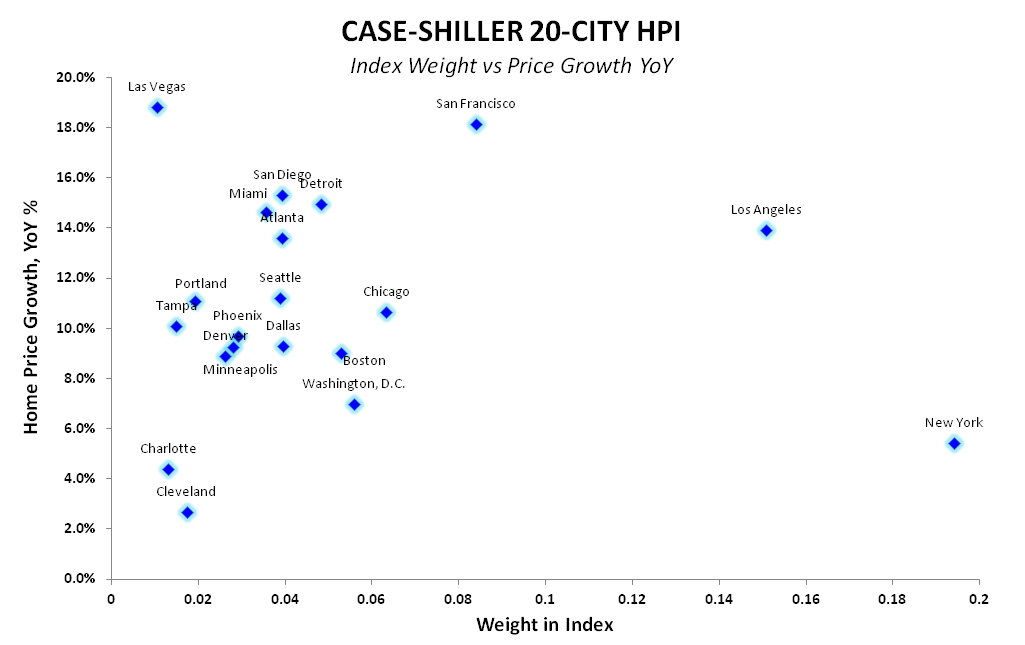
* Case-Shiller: decelerates 160bps sequentially to +10.8% YoY from +12.4% in March, the fastest rate of sequential deceleration since March of 2008
- Prices decelerating across 19 of 20 cities with Boston the lone city registering sequential acceleration
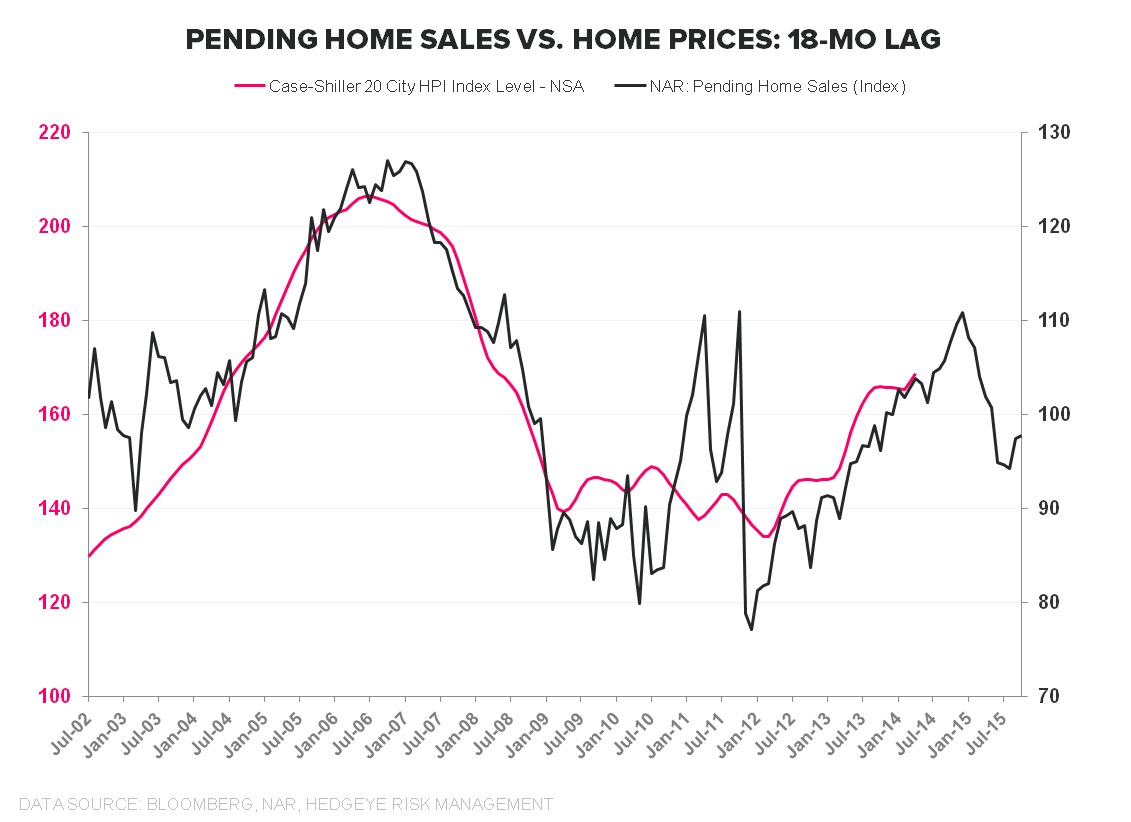
- Demand Model looking solid with case-shiller still tracking pending nicely on an 18-mo lag.
* FHFA: decelerates 60bps to +5.9% YoY from 6.5% in March, matching the fastest rate of sequential deceleration since October of 2011.


Bottom Line:
The Existing Home Market and New Home Market continue to bifurcate with the latter showing marginal signs of strength and the former continuing to cool. Pricing trends, however, are softening as falling demand in the existing market manifests as pricing weakness on a lag.
About New Home Sales:
Each month the Census Department releases the New Home Sales report, which measures the number of newly constructed homes that have been sold in the month. The difference between the New Home Sales report and the Starts and Permits report is that New Home Sales only includes single family spec homes built and sold by builders, and does not include condos, apartments, or owner-built units. This is why New Home Sales typically run at roughly half the rate of Starts.
About Case Shiller:
The S&P/Case-Shiller Home Price Index measures the changes in value of residential real estate by tracking single-family home re-sales in 20 metropolitan areas across the US. The index uses purchase price information obtained from county assessor and recorder offices. The Case-Shiller indexes are value-weighted, meaning price trends for more expensive homes have greater influence on estimated price changes than other homes. It is vital to note that the index’s printed number is a 3-month rolling average released on a two month delay.
Frequency and Release Date:
The S&P/Case-Shiller HPI is released on the last Tuesday of every month. The index is on a two month lag and therefore does not reflect the most recent month’s home prices.
Joshua Steiner, CFA
Christian B. Drake